
Prometheus Essentials: Install and Start Monitoring Your App

In this Prometheus article, it's time to roll up our sleeves and get our hands dirty with some real-world (or should I say "space-world") monitoring. We're going to set up Prometheus on our computer and create an app that sells the most popular product in the entire galaxy: Space Bananas 🍌. Space monkeys 👽 absolutely love these things, and now, we’re bringing them to our very own grocery shop app.
Prometheus Series
This post is part of a Prometheus series.
Prometheus Essentials: Introduction To Metric Types
Prometheus Essentials: Install and Start Monitoring Your App (THIS ARTICLE)
Prometheus Essentials: Node exporter And System Monitoring
Requirements
The entire series is written in a way that beginners can easily follow along. The goal is to explain concepts in a very simple manner. Although it is beginner-friendly, it doesn’t mean it is completely free of requirements. I anticipate the following prerequisites:
Coding: You should have some coding skills, preferably in Python. This is because we have a simple Flask app, but I won’t be covering how to create virtual environments, install modules, etc. I assume you already know that.
Containers: You should be familiar with basic container techniques. Nothing too advanced, but we won’t be covering the basics either.
Computer Savvy: We don’t cover what’s considered essential computer knowledge you should already be comfortable with the basics 😂
Installing Prometheus locally
The first thing we need to do is install Prometheus, but instead of installing it directly on our machine, we're going to use Docker. Why? Because Docker makes life easier, and space monkeys love it.
Docker is like the spaceship that will help us deploy our monitoring solution anywhere in the galaxy (ok, not exactly but almost). To install Docker, head over to Docker's website and follow the instructions for your operating system. Once you've got Docker installed, you're ready to launch Prometheus.
You can create your own folder structure or simply clone the project repository:
git clone https://github.com/devoriales/prometheus-tutorials.gitPersistent Storage for Prometheus:
If we don't want to lose our metrics every time the container restarts (which, let's be honest, is pretty important), we need to set up persistent storage.
There are several ways. We could use a command like docker volume create prometheus-config
but instead, let's create create a directory on our local file system and bind it to the container:
mkdir -p ~/prometheus/config ~/prometheus/dataUsing a Custom Configuration File
If you want to use a custom configuration, we'll need to bind-mount our Prometheus configuration file into the container. We'll create it inside the directory that we previously created:
prometheus.yml
 cat <<EOF >> ~/prometheus/config/prometheus.yml
heredoc>
global:
  scrape_interval: 15s  # Default scrape interval for all jobs

scrape_configs:
  # Scrape configuration for Flask app
  - job_name: 'flask_app'
    scrape_interval: 10s  # Custom scrape interval for the Flask app
    scrape_timeout: 5s     # Maximum time to wait for a scrape to complete
    metrics_path: '/custom-metrics'  # Custom endpoint for metrics (if you change the default)
    static_configs:
      - targets: ['host.docker.internal:5000']  # Target (your Flask app running on Docker)

  # Scrape configuration for Node Exporter
  - job_name: 'node_exporter'
    static_configs:
      - targets: ['host.docker.internal:9100']  # Target (Node Exporter for system metrics)

heredoc> EOF
❗This file is also available in the GitHub repository if you choose to clone.
As you can see, we can set custom configurations for each thing we want to monitor , for instance, we can change the endpoint, scrape interval etc. By default, Prometheus will scrape /metrics endpoint if you don't specify a specific custom endpoint. For our app, it will be /custom-metrics endpoint.
Start Prometheus
With the following, we'll pull the Prometheus image and start the Prometheus instance:
docker run -p 9090:9090 \
  -v ~/prometheus/config/prometheus.yml:/etc/prometheus/prometheus.yml \
  -v ~/prometheus/data:/prometheus \
  prom/prometheus
-p 9090:9090: Maps port 9090 from the container to port 9090 on the host machine, allowing access to Prometheus athttp://localhost:9090.-v ~/prometheus/config/prometheus.yml:/etc/prometheus/prometheus.yml: Mounts the Prometheus configuration file from the host machine (~/prometheus/config/prometheus.yml) to the container (/etc/prometheus/prometheus.yml), allowing Prometheus to use your custom config.-v ~/prometheus/data:/prometheus: Mounts a directory from the host machine (~/prometheus/data) to the container (/prometheus), ensuring persistent storage of Prometheus’s scraped metrics.
You can now access Prometheus UI at http://localhost:9090
Space Grocery Shop App
Let's build a cool Space Grocery Shop, a Flask application that sells Space Bananas. They’re allegedly healthy, radioactive, and are the favorite snack of space monkeys.
Install Flask:
pip install FlaskCreate a new file called app.py and let’s get into the code.
Here’s a simple Flask app that helps us selling the Space Bananas:
"""
This is a space grocery shop application that sells space bananas to space monkeys.
It is used to demonstrate how to instrument an app with Prometheus metrics.

devoriales.com
date: 2024-10-10
author: Aleksandro Matejic
"""

import logging
import random
import time

from flask import Flask, render_template_string, request
from prometheus_client import Counter, Gauge, Histogram, generate_latest

app = Flask(__name__)

# Prometheus metrics
SPACE_BANANA_PURCHASES = Counter(
    "space_banana_purchases_total", "Total number of space bananas purchased"
)
SPACE_BANANA_SALES = Counter(
    "space_banana_sales_total", "Total revenue from space banana sales"
)
ACTIVE_USERS = Gauge(
    "active_users", "Number of active users (space monkeys currently online)"
)

# Histogram of checkout durations
CHECKOUT_DURATION_HISTOGRAM = Histogram(
    "checkout_duration_seconds",
    "Histogram of checkout durations in seconds",
    buckets=[0.5, 1, 2.5, 5, 7.5, 10],
)


@app.route("/", methods=["GET", "POST"])
def home():
    space_banana_price = 5
    if request.method == "POST":
        random_checkout_duration = random.uniform(1, 3)
        logging.info("Space Banana purchasing request")
        SPACE_BANANA_SALES.inc(space_banana_price)  # Increase revenue

        with CHECKOUT_DURATION_HISTOGRAM.time():
            # Simulate the checkout process taking some time
            time.sleep(random_checkout_duration)
            SPACE_BANANA_PURCHASES.inc()

    ACTIVE_USERS.inc()  # Increase the number of active users
    return render_template_string(
        """
        <h1>Welcome to the Space Grocery Shop!</h1>
        <p>We sell Space Bananas, loved by space monkeys everywhere!</p>
        <form method="post">
            <button type="submit"><b>Buy Space Banana</b></button>
        </form>
        <p>Total Space Bananas Sold: {{ bananas_sold }}</p>
    """,
        bananas_sold=SPACE_BANANA_PURCHASES._value.get(),
    )


@app.route("/custom-metrics")
def metrics():
    """
    Expose Prometheus metrics
    """
    result = generate_latest()
    logging.info("Metrics requested")
    return result, 200, {"Content-Type": "text/plain; charset=utf-8"}


if __name__ == "__main__":
    app.run(port=5000, debug=True)
In the app, we have the following metrics that we collect and expose:
SPACE_BANANA_PURCHASES (Counter)
- Metric Name: space_banana_purchases_total
- Description: Tracks the total number of space bananas purchased.
- Behavior: Only increases over time (can never decrease).
SPACE_BANANA_SALES (Counter)
- Metric Name: space_banana_sales_total
- Description: Tracks the total revenue from space banana sales.
- Behavior: Only increases over time (can never decrease).
ACTIVE_USERS (Gauge)
- Metric Name: active_users
- Description: Tracks the number of active users (space monkeys currently online).
- Behavior: Can both increase and decrease over time.
CHECKOUT_DURATION_HISTOGRAM (Histogram)
- Metric Name: checkout_duration_seconds
- Description: Measures the distribution of checkout durations for space bananas.
- Behavior: Records checkout durations into predefined buckets (e.g., how many checkouts took less than or equal to 0.5s, 1s, 2.5s, etc.).
Let's start our app:
python space_grocery_shop/app.py
 * Serving Flask app 'app'
 * Debug mode: on
WARNING: This is a development server. Do not use it in a production deployment. Use a production WSGI server instead.
 * Running on http://127.0.0.1:5000
Press CTRL+C to quit
 * Restarting with stat
 * Debugger is active!
 * Debugger PIN: 378-627-542
You can access the shop on http://127.0.0.1:5000
Querying the Metrics From the Application Endpoint
Now that our Space Grocery Shop app is up and running, and Prometheus is scraping metrics from our system, it's time to learn how to query those metrics using PromQL, the Prometheus’ query language.
But before we do that, we can actually verify that our application is exposing the metrics.
In the browser, check the following endpoing of our application
http://127.0.0.1:5000/custom-metrics
You should get some results like this:
# HELP python_gc_objects_collected_total Objects collected during gc
# TYPE python_gc_objects_collected_total counter
python_gc_objects_collected_total{generation="0"} 1628.0
python_gc_objects_collected_total{generation="1"} 84.0
python_gc_objects_collected_total{generation="2"} 0.0
# HELP python_gc_objects_uncollectable_total Uncollectable objects found during GC
# TYPE python_gc_objects_uncollectable_total counter
python_gc_objects_uncollectable_total{generation="0"} 0.0
python_gc_objects_uncollectable_total{generation="1"} 0.0
python_gc_objects_uncollectable_total{generation="2"} 0.0
# HELP python_gc_collections_total Number of times this generation was collected
# TYPE python_gc_collections_total counter
...
Verify Targets in Prometheus
To ensure that Prometheus is properly scraping metrics from all our configured targets, we need to verify that our targets are correctly set up in Prometheus.
-
Access the Targets Page:
Open Prometheus at http://localhost:9090/targets.
It should show something like: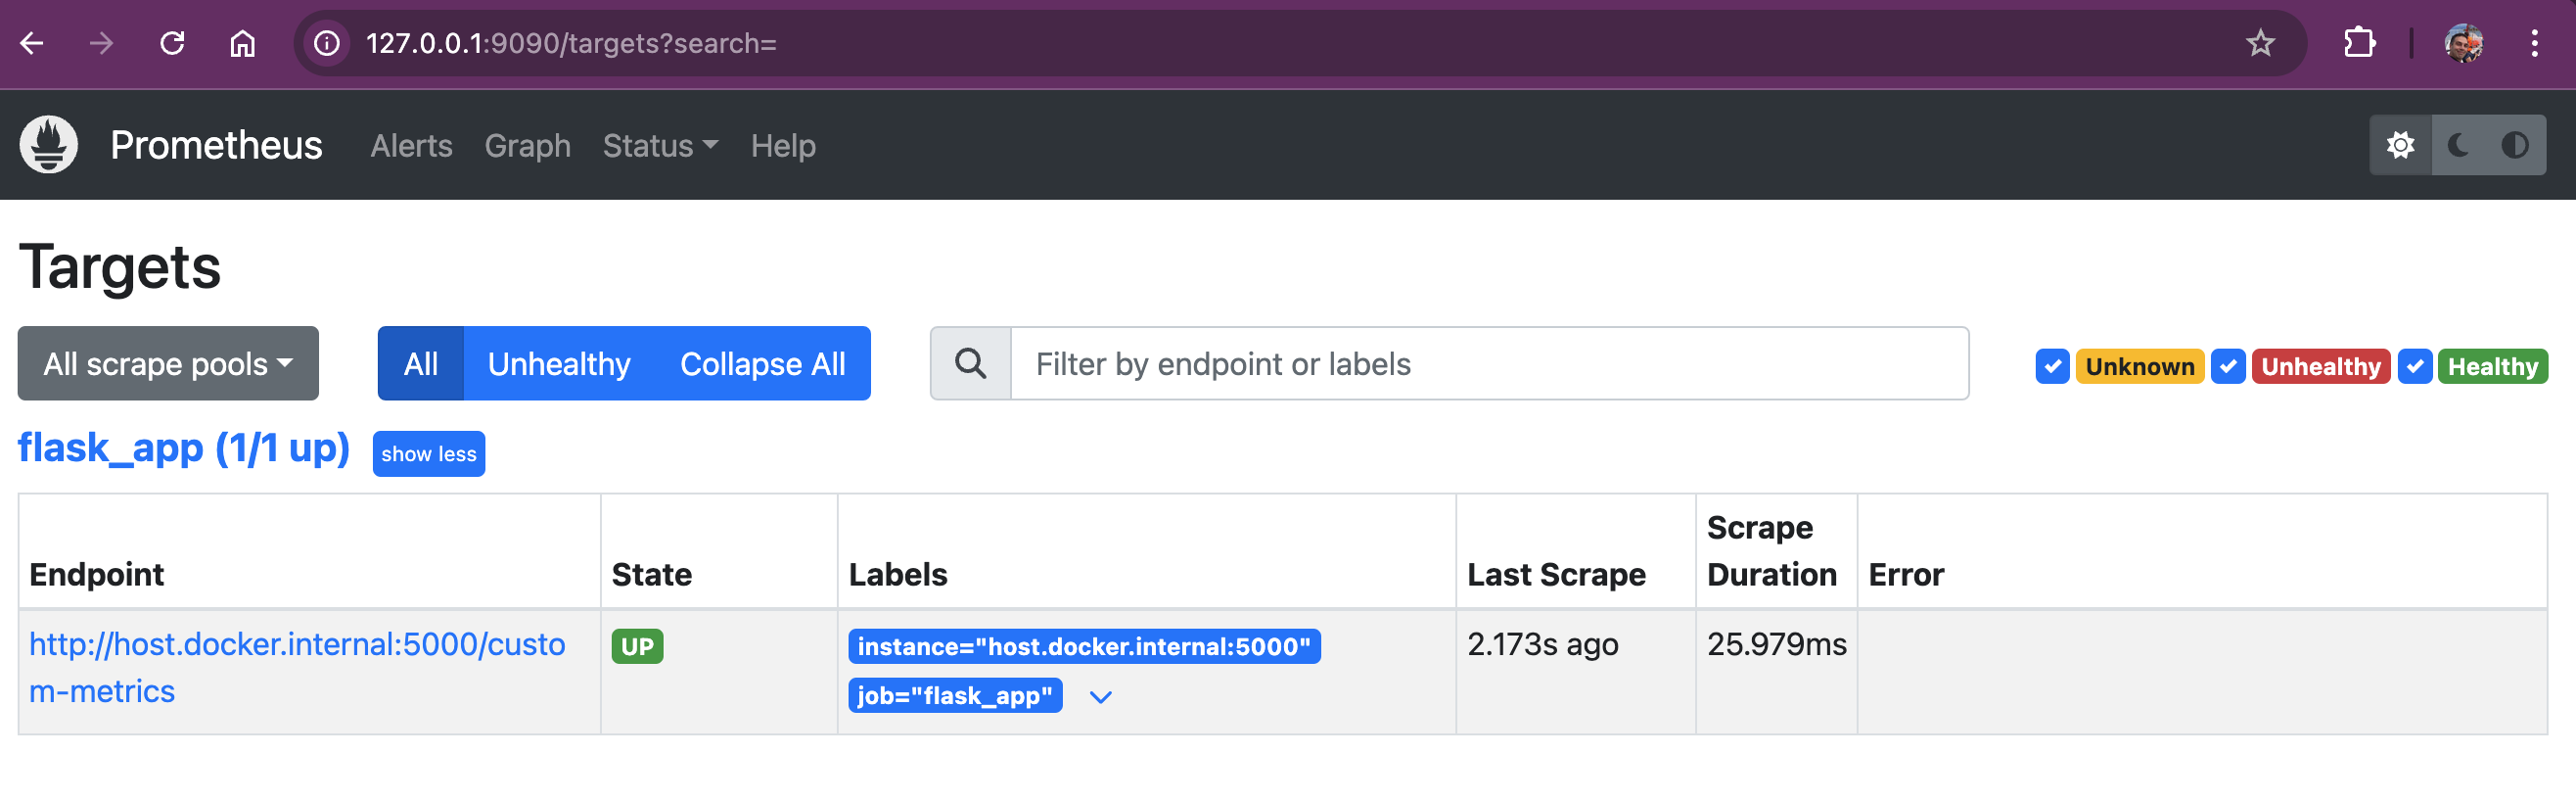
-
Check the Target Status:
On the Targets page, we will see a list of all configured targets. Each target will show its current status, such as
UPorDOWN. AnUPstatus means that Prometheus is successfully scraping metrics from the target, whileDOWNindicates that there may be an issue. -
Review Scrape Intervals and Errors:
Each target entry will also show the last scrape duration, the time since the last successful scrape, and any errors encountered. If any targets are
DOWN, we should verify the target configurations inprometheus.ymland ensure that the services are running and accessible.
Verifying targets helps us quickly identify and fix any issues that might prevent Prometheus from collecting important metrics. It ensures our Space Grocery Shop and system metrics are always being properly monitored.
Accessing the Prometheus Query Interface
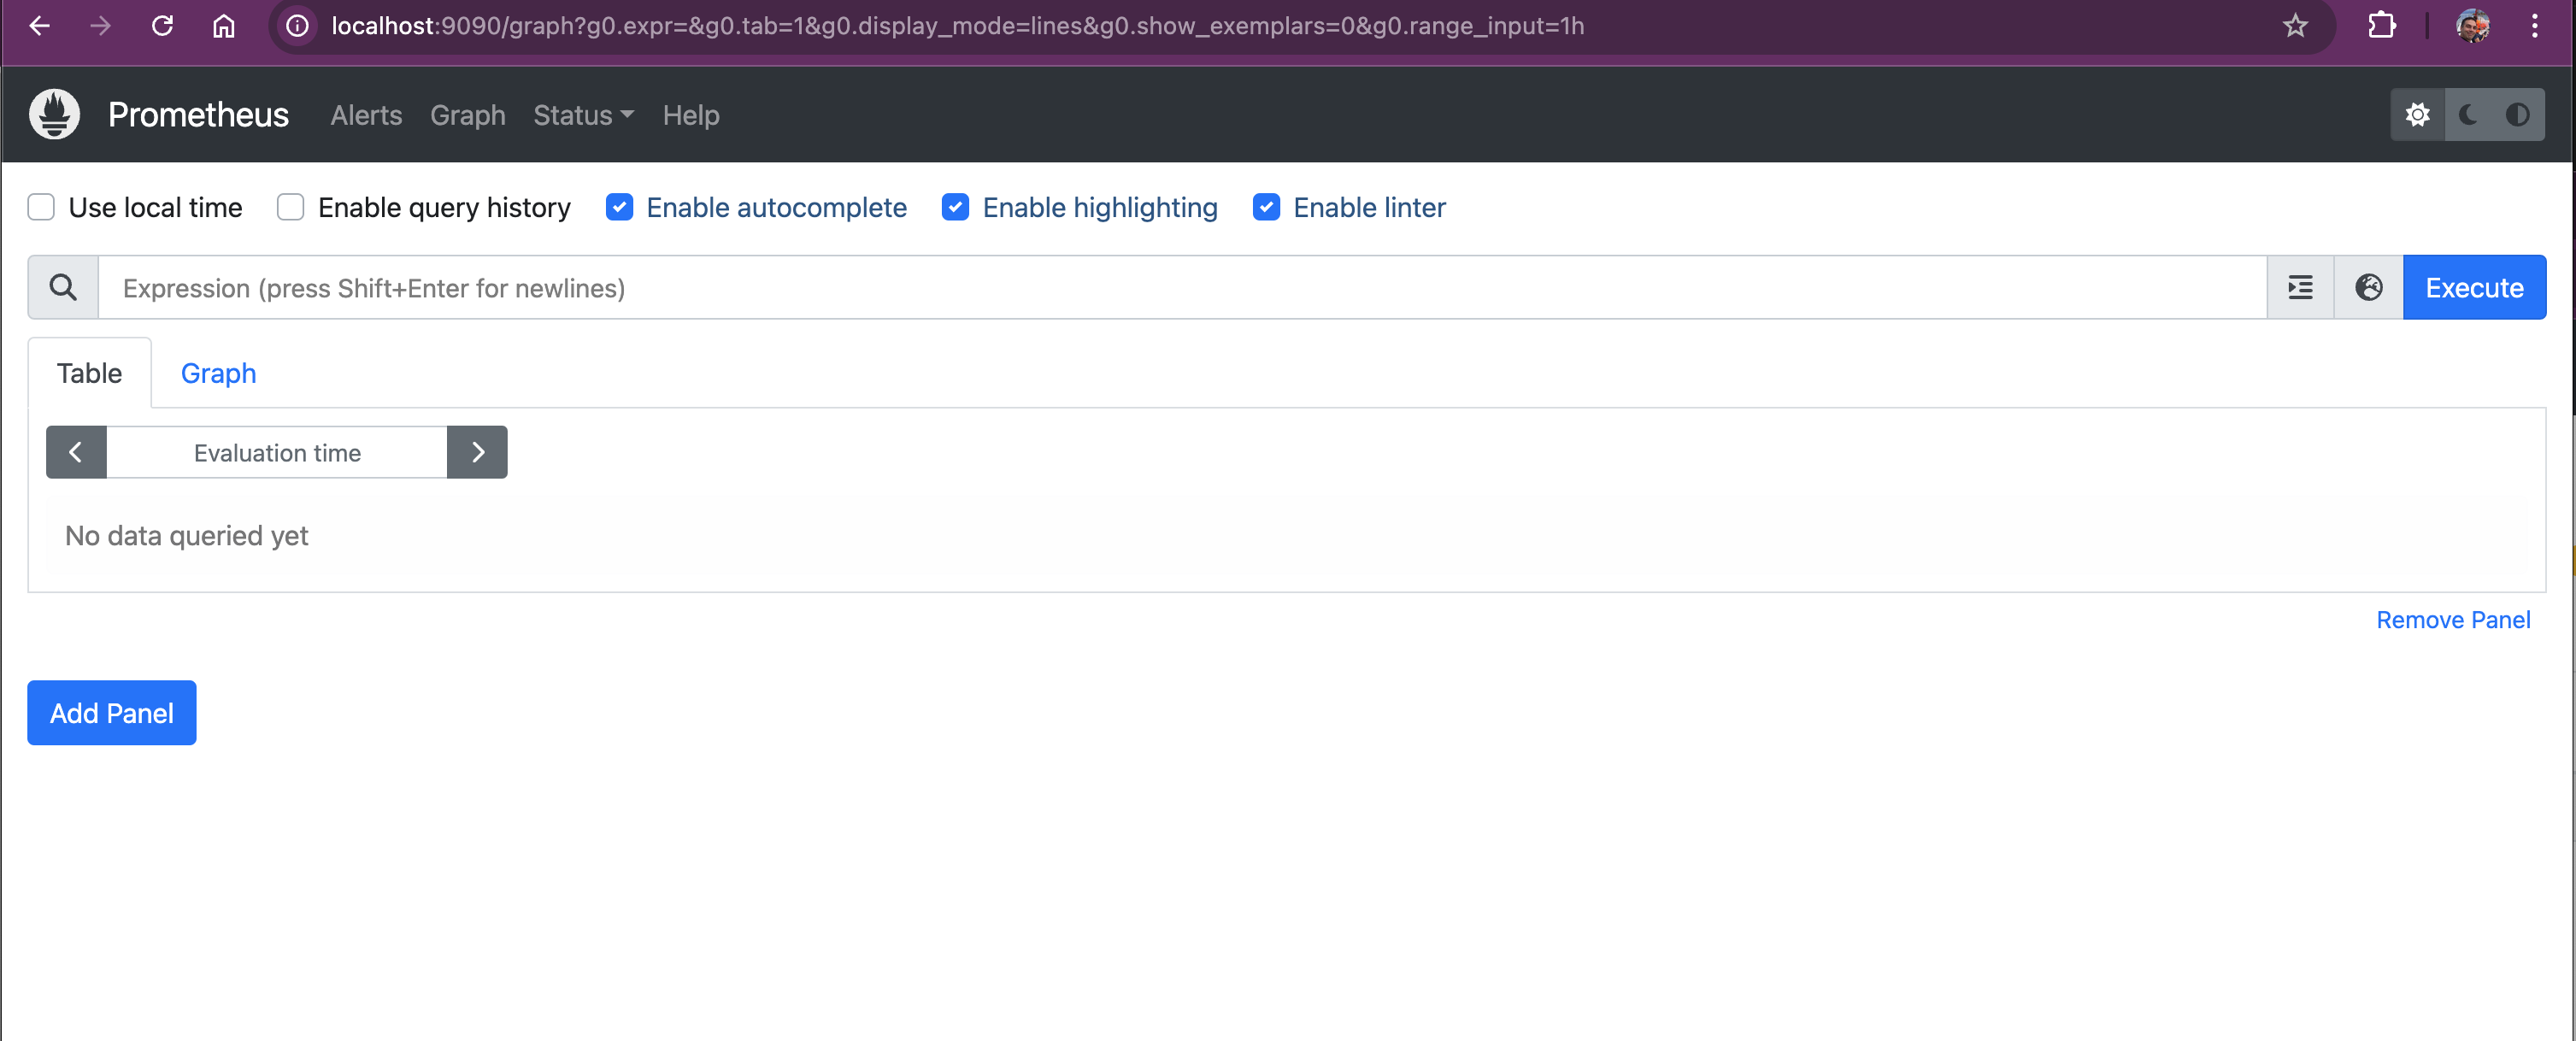
First, to start querying, head over to the Prometheus instance at http://localhost:9090
This is where you can enter your PromQL queries and visualize the results in either graph or table format.
Querying the Basics
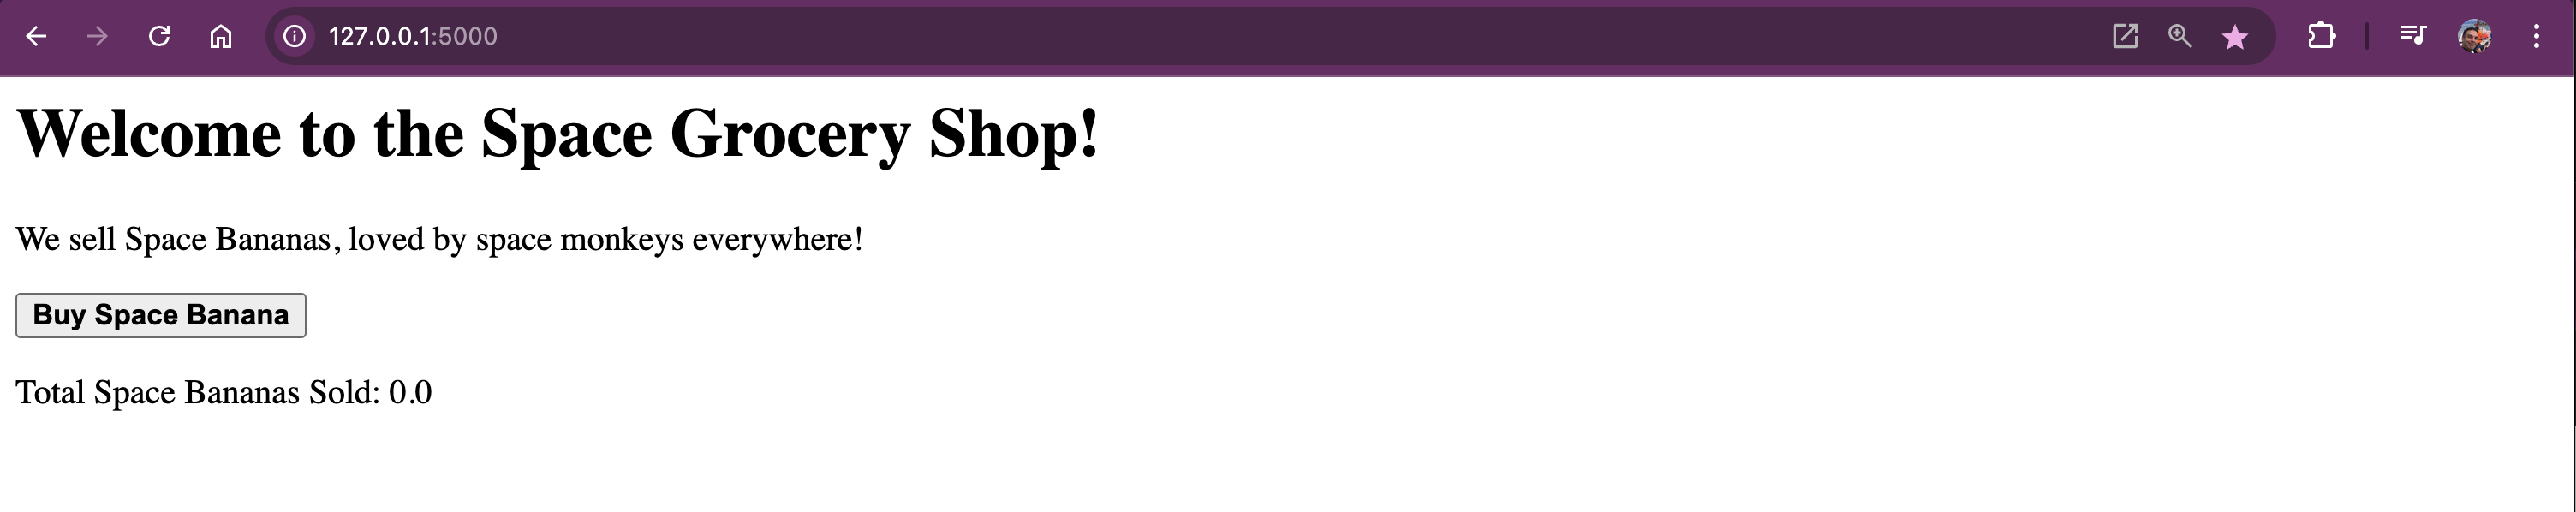
As always when you start a new business, you don't have any purchases, but if you press on the "Buy Space Banana" buttons a few times, you should see the counter increase. You're making 💲😀
Go and shop at: http://127.0.0.1:5000
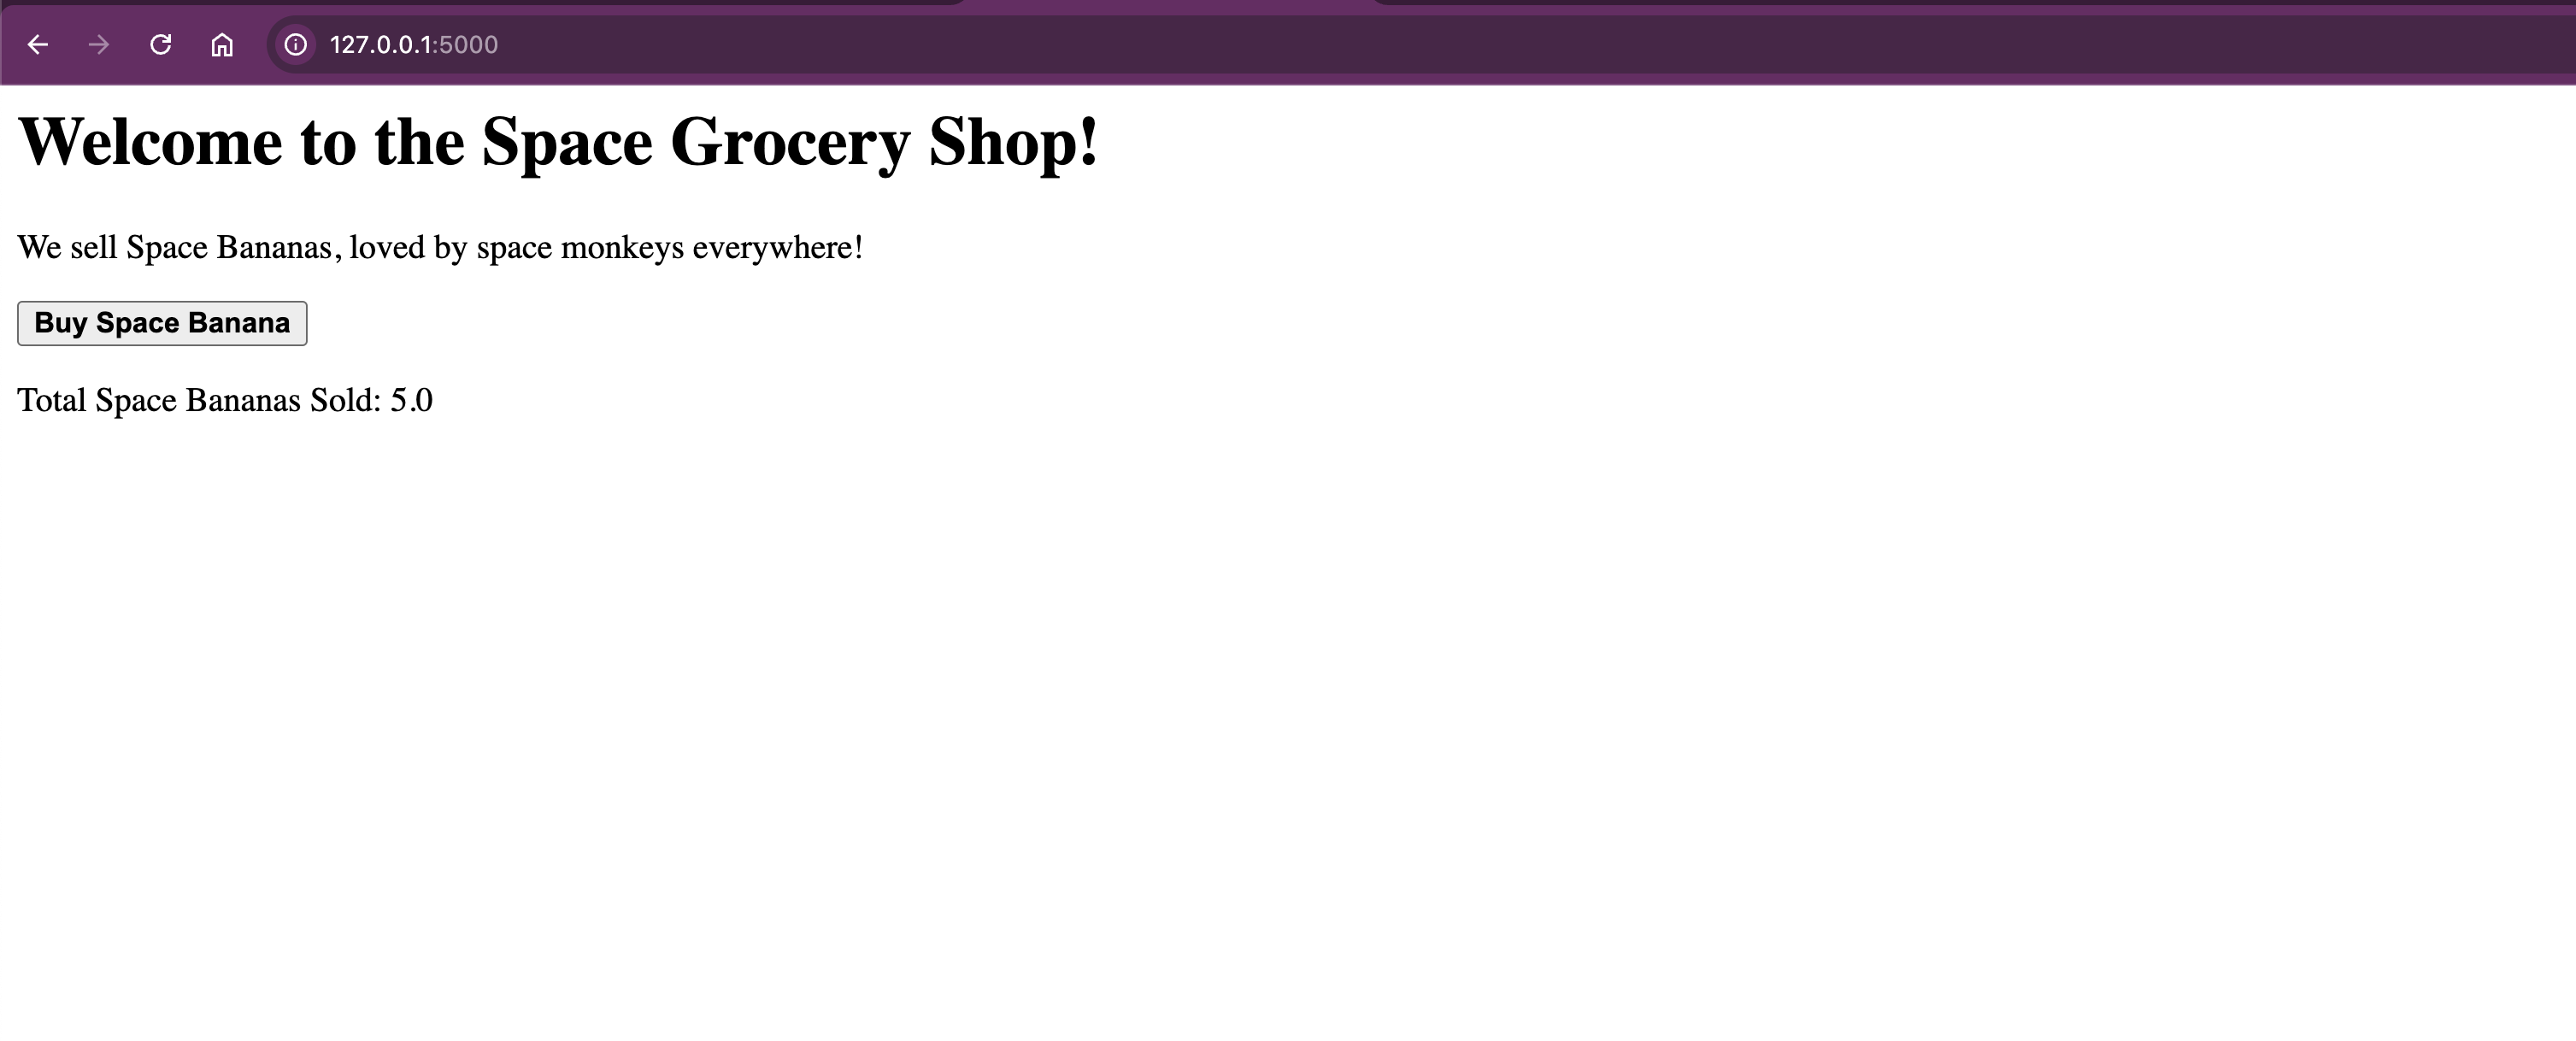
For example, let's buy 5 bananas:
Switch over to Prometheus query editor on http://localhost:9090/
Number of Banana puarchased - Counter Metric
In Prometheus, a Counter metric is perfect for tracking things that can only go up, like the total number of bananas sold in your Space Grocery Shop app. A counter only increases and never decreases, except when it resets (for example, when the application restarts). This makes it ideal for tracking cumulative totals, like purchases, completed tasks, or errors. ❗Prometheus will not drop any data just because you restart your application. The reason is, we've created a directory that is mounted as a volume in ~/prometheus/data
In the Space Grocery Shop app, we’ve set up a counter metric called space_banana_purchases_total to track the total number of space bananas sold. You can query this counter in Prometheus to see how many bananas have been purchased so far:
space_banana_purchases_total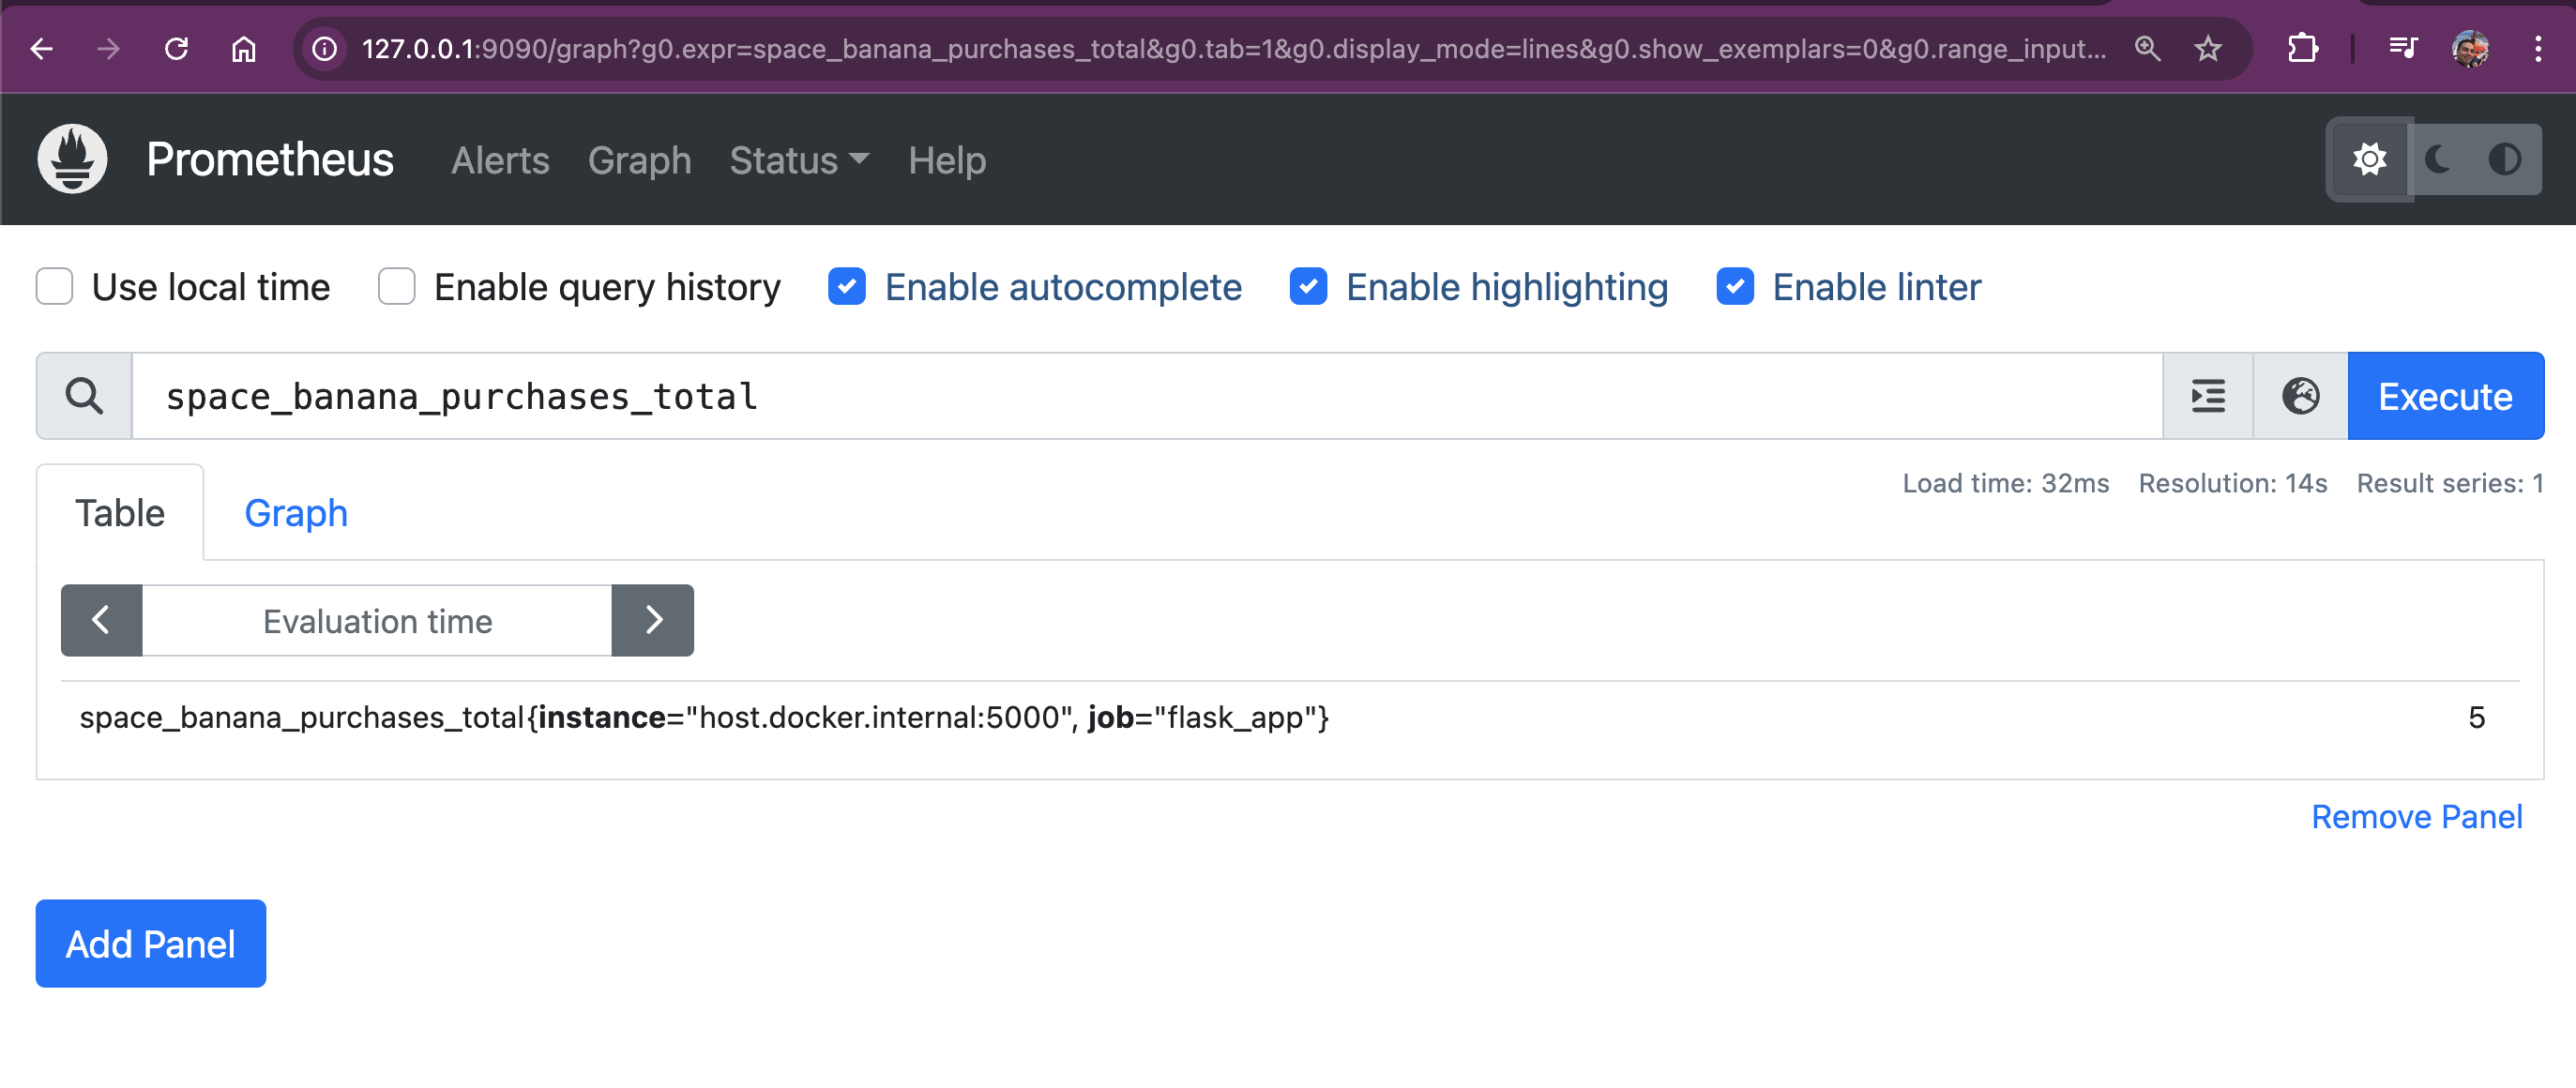
This query returns the total number of bananas sold, increasing every time a space monkey buys a new banana.
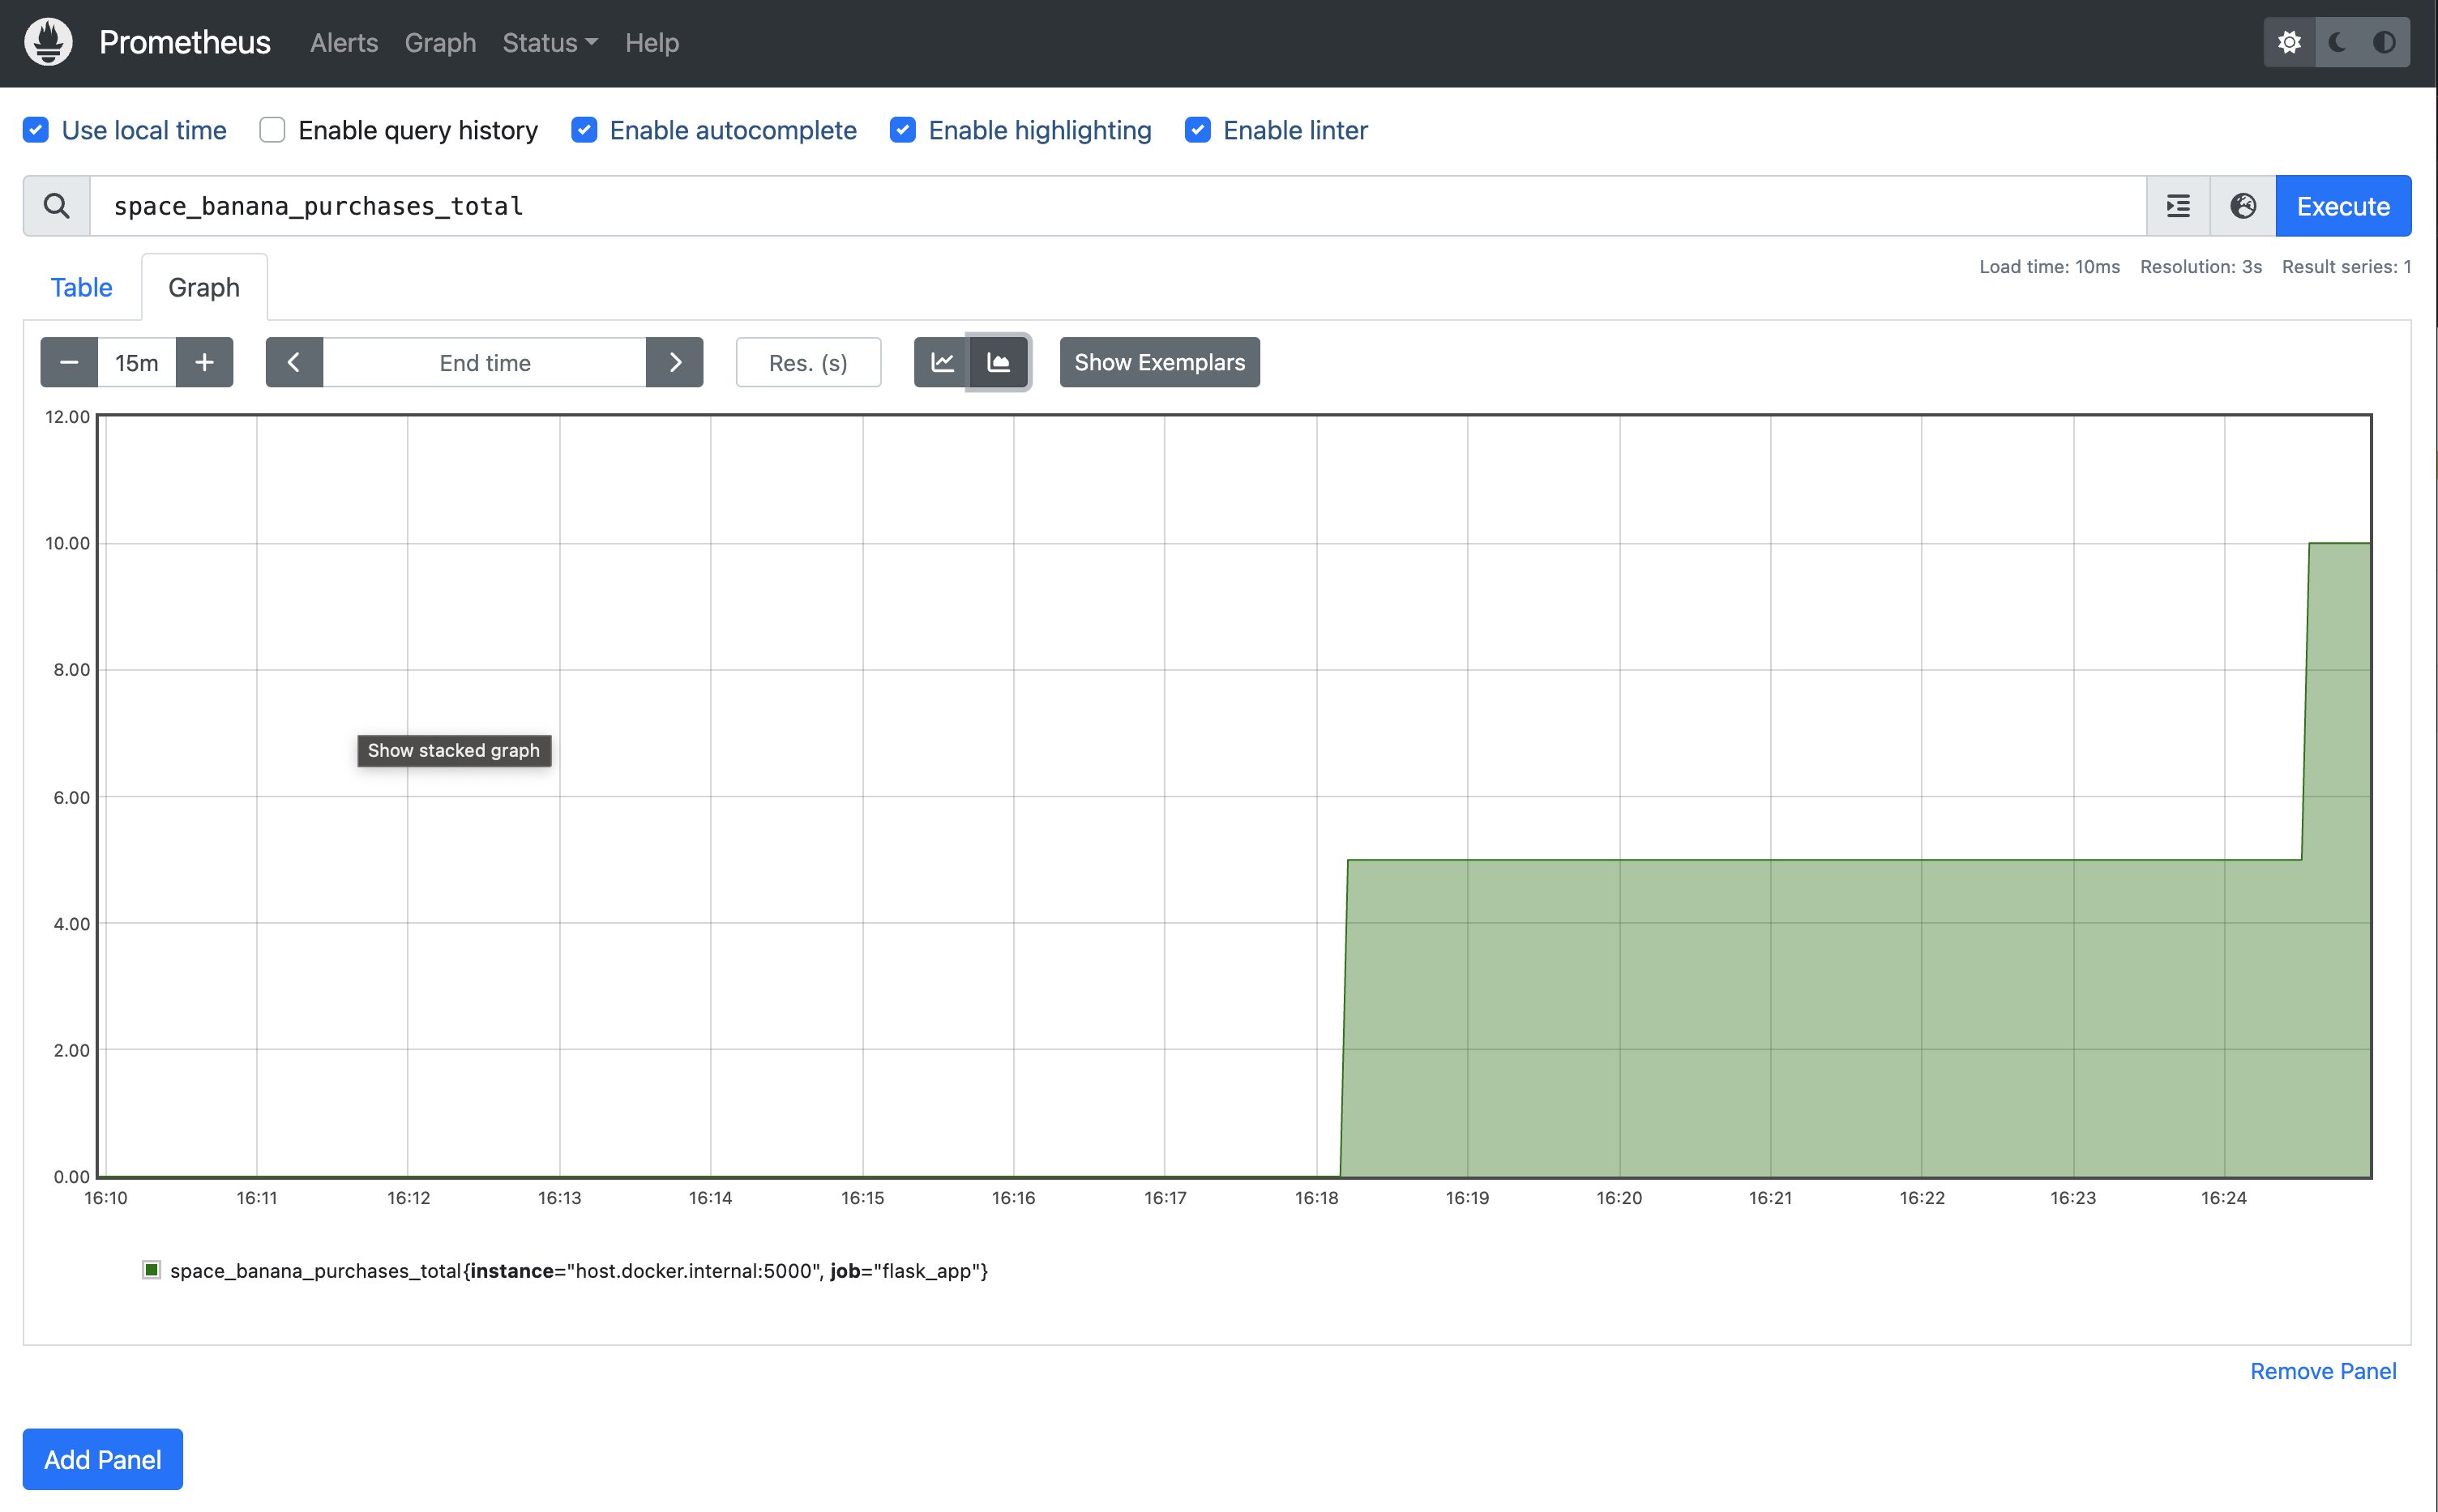
Buy 5 more, so you have total number of 10.
To make things more interesting, you can switch to the Graph tab in Prometheus to visualize the increase in banana purchases over time. The counter will show a steadily increasing line, as the total number of purchases continues to climb:
Another one, let's see how much money we made.
Enter the following metric name:
space_banana_sales_totalNow we should see amont of 💲 we made. Since the price is $5 for each space banana (yeah it's expensive with high-end bananas) we made $50, yeaaah! Now we make some bucks here.
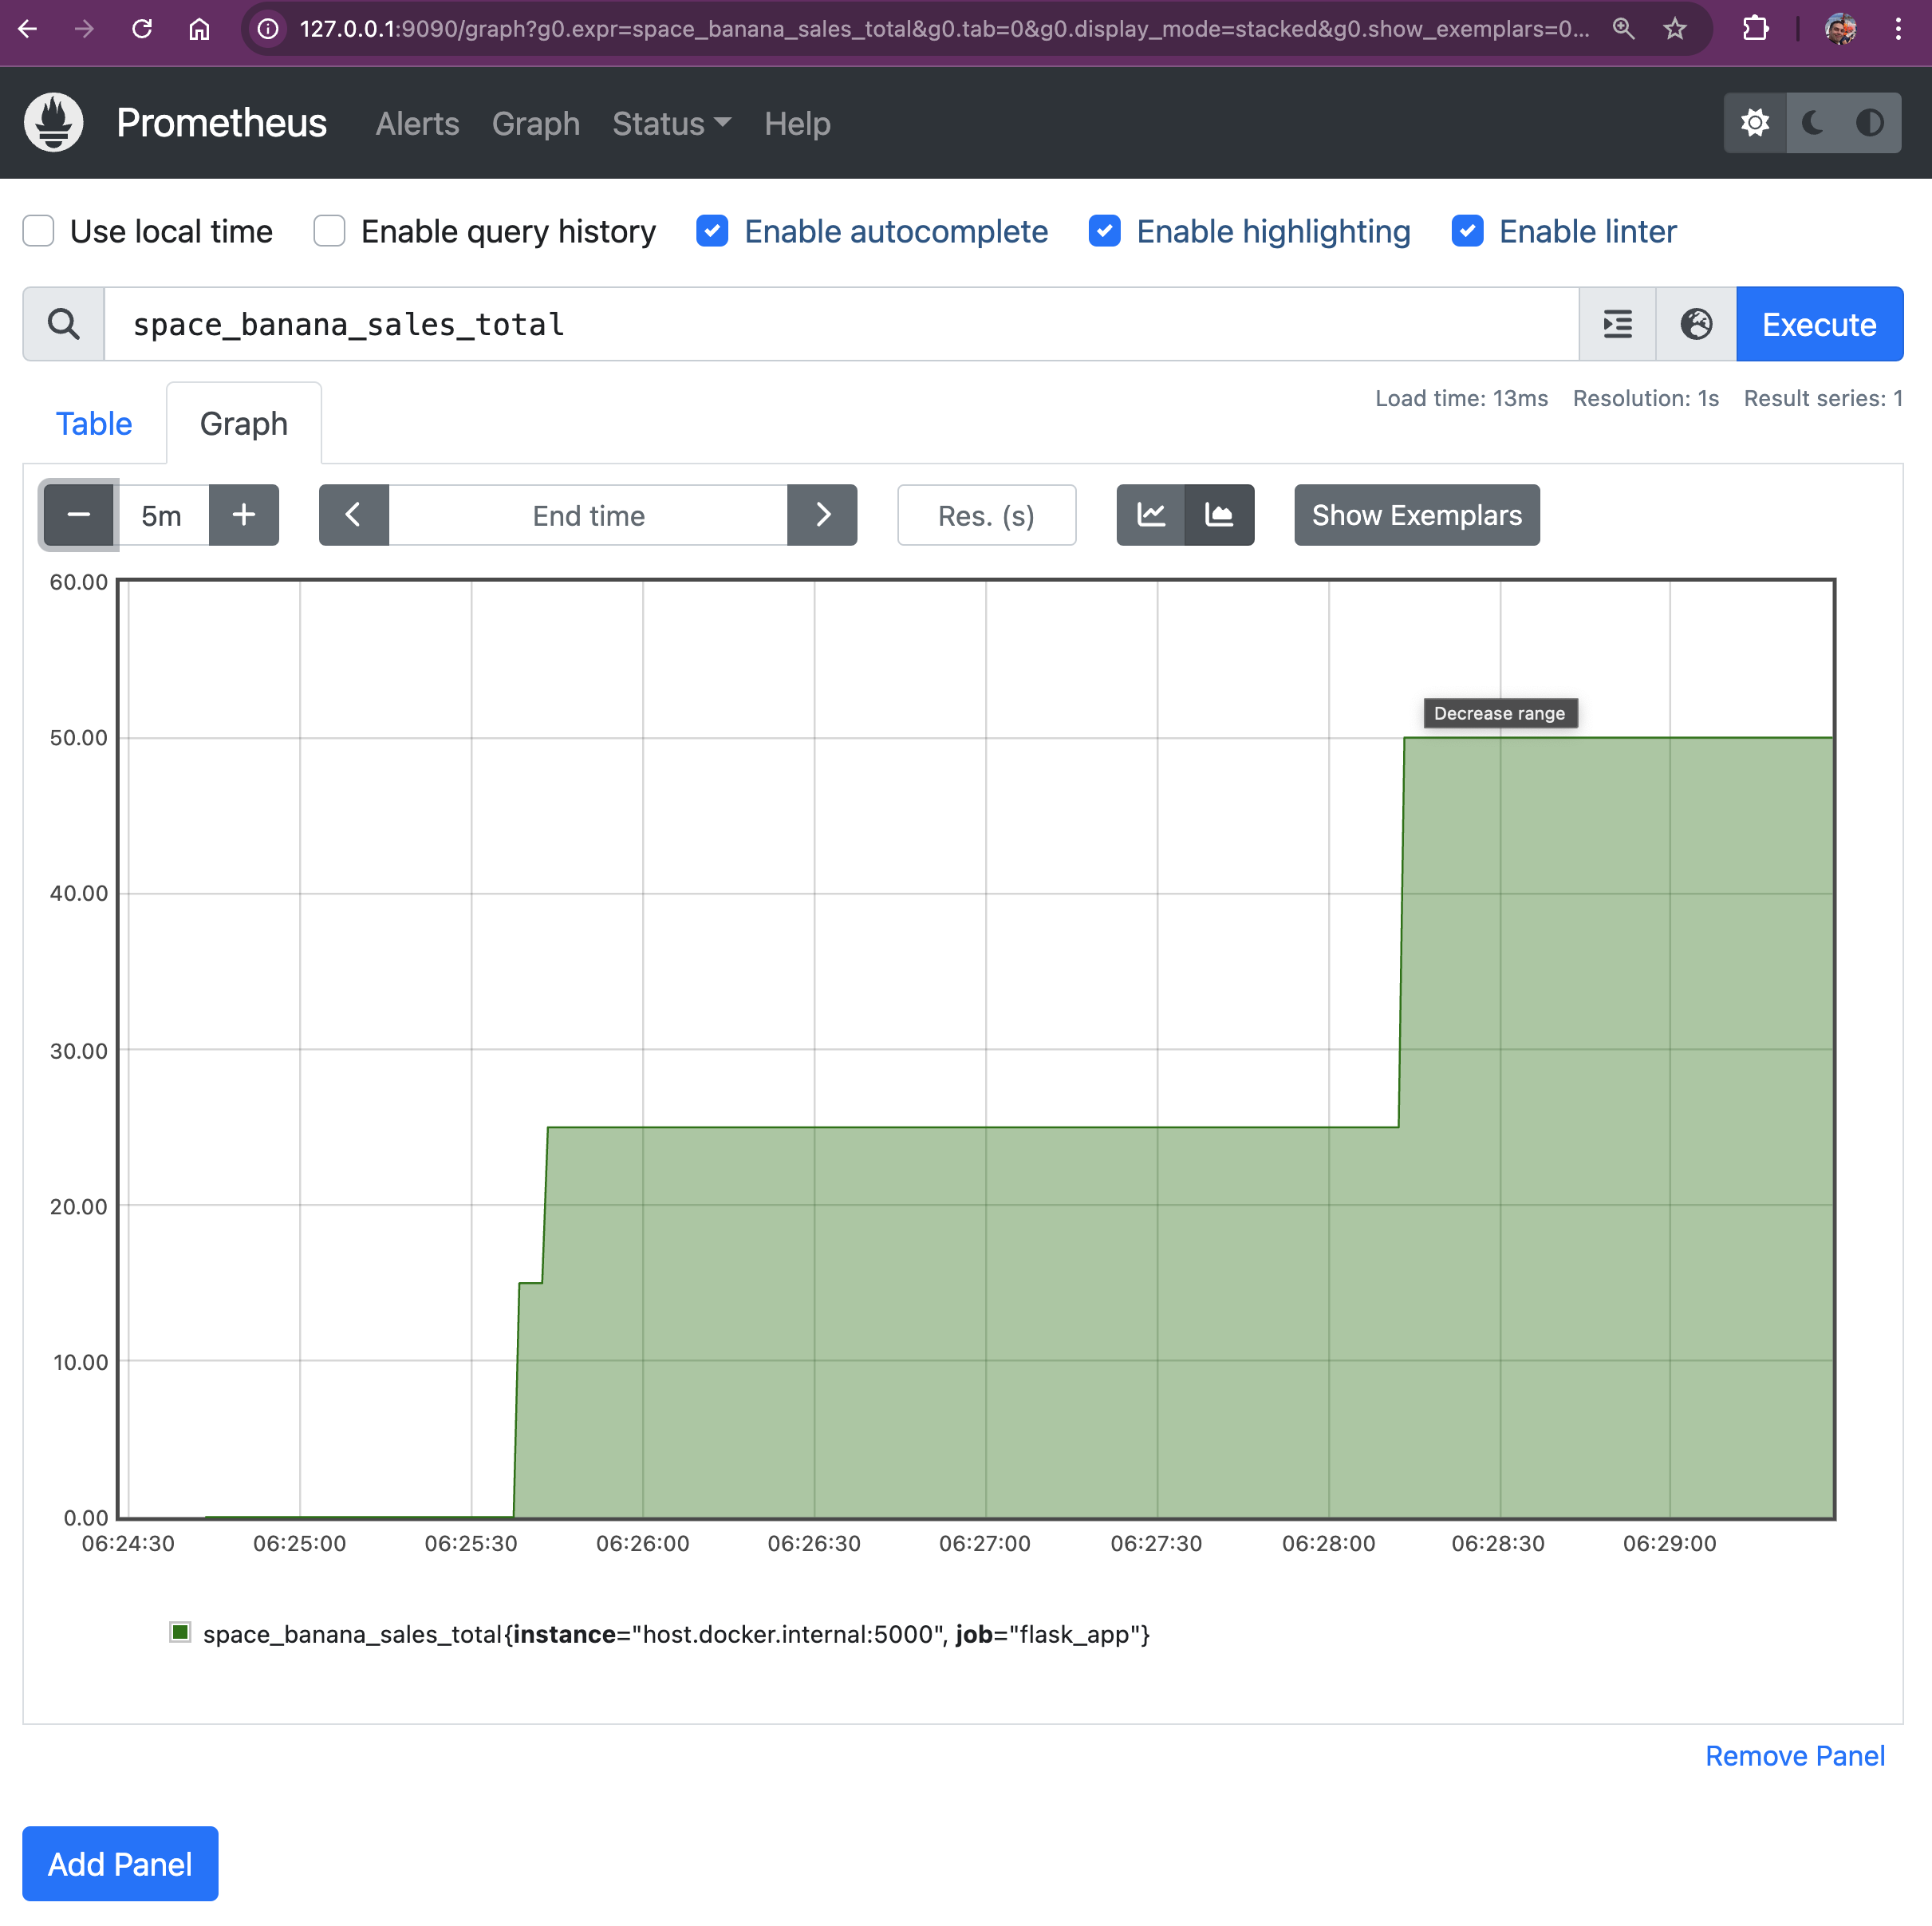 Since it's time series database, we can exactly see when the purchases have been made.
This is so fun 😀
Why Counters Are Useful
Counters are useful when tracking events that should only ever increase, like the number of times an event has occurred (e.g., HTTP requests, completed transactions, or in our case, banana purchases). In Prometheus, counters make it easy to track totals over time and alert you if something stops increasing (e.g., if sales stall or errors spike).
Number of Active Users - Gauge Metric
We used a Gauge to track the number of active users. This query will give us the current number of active users in the shop:
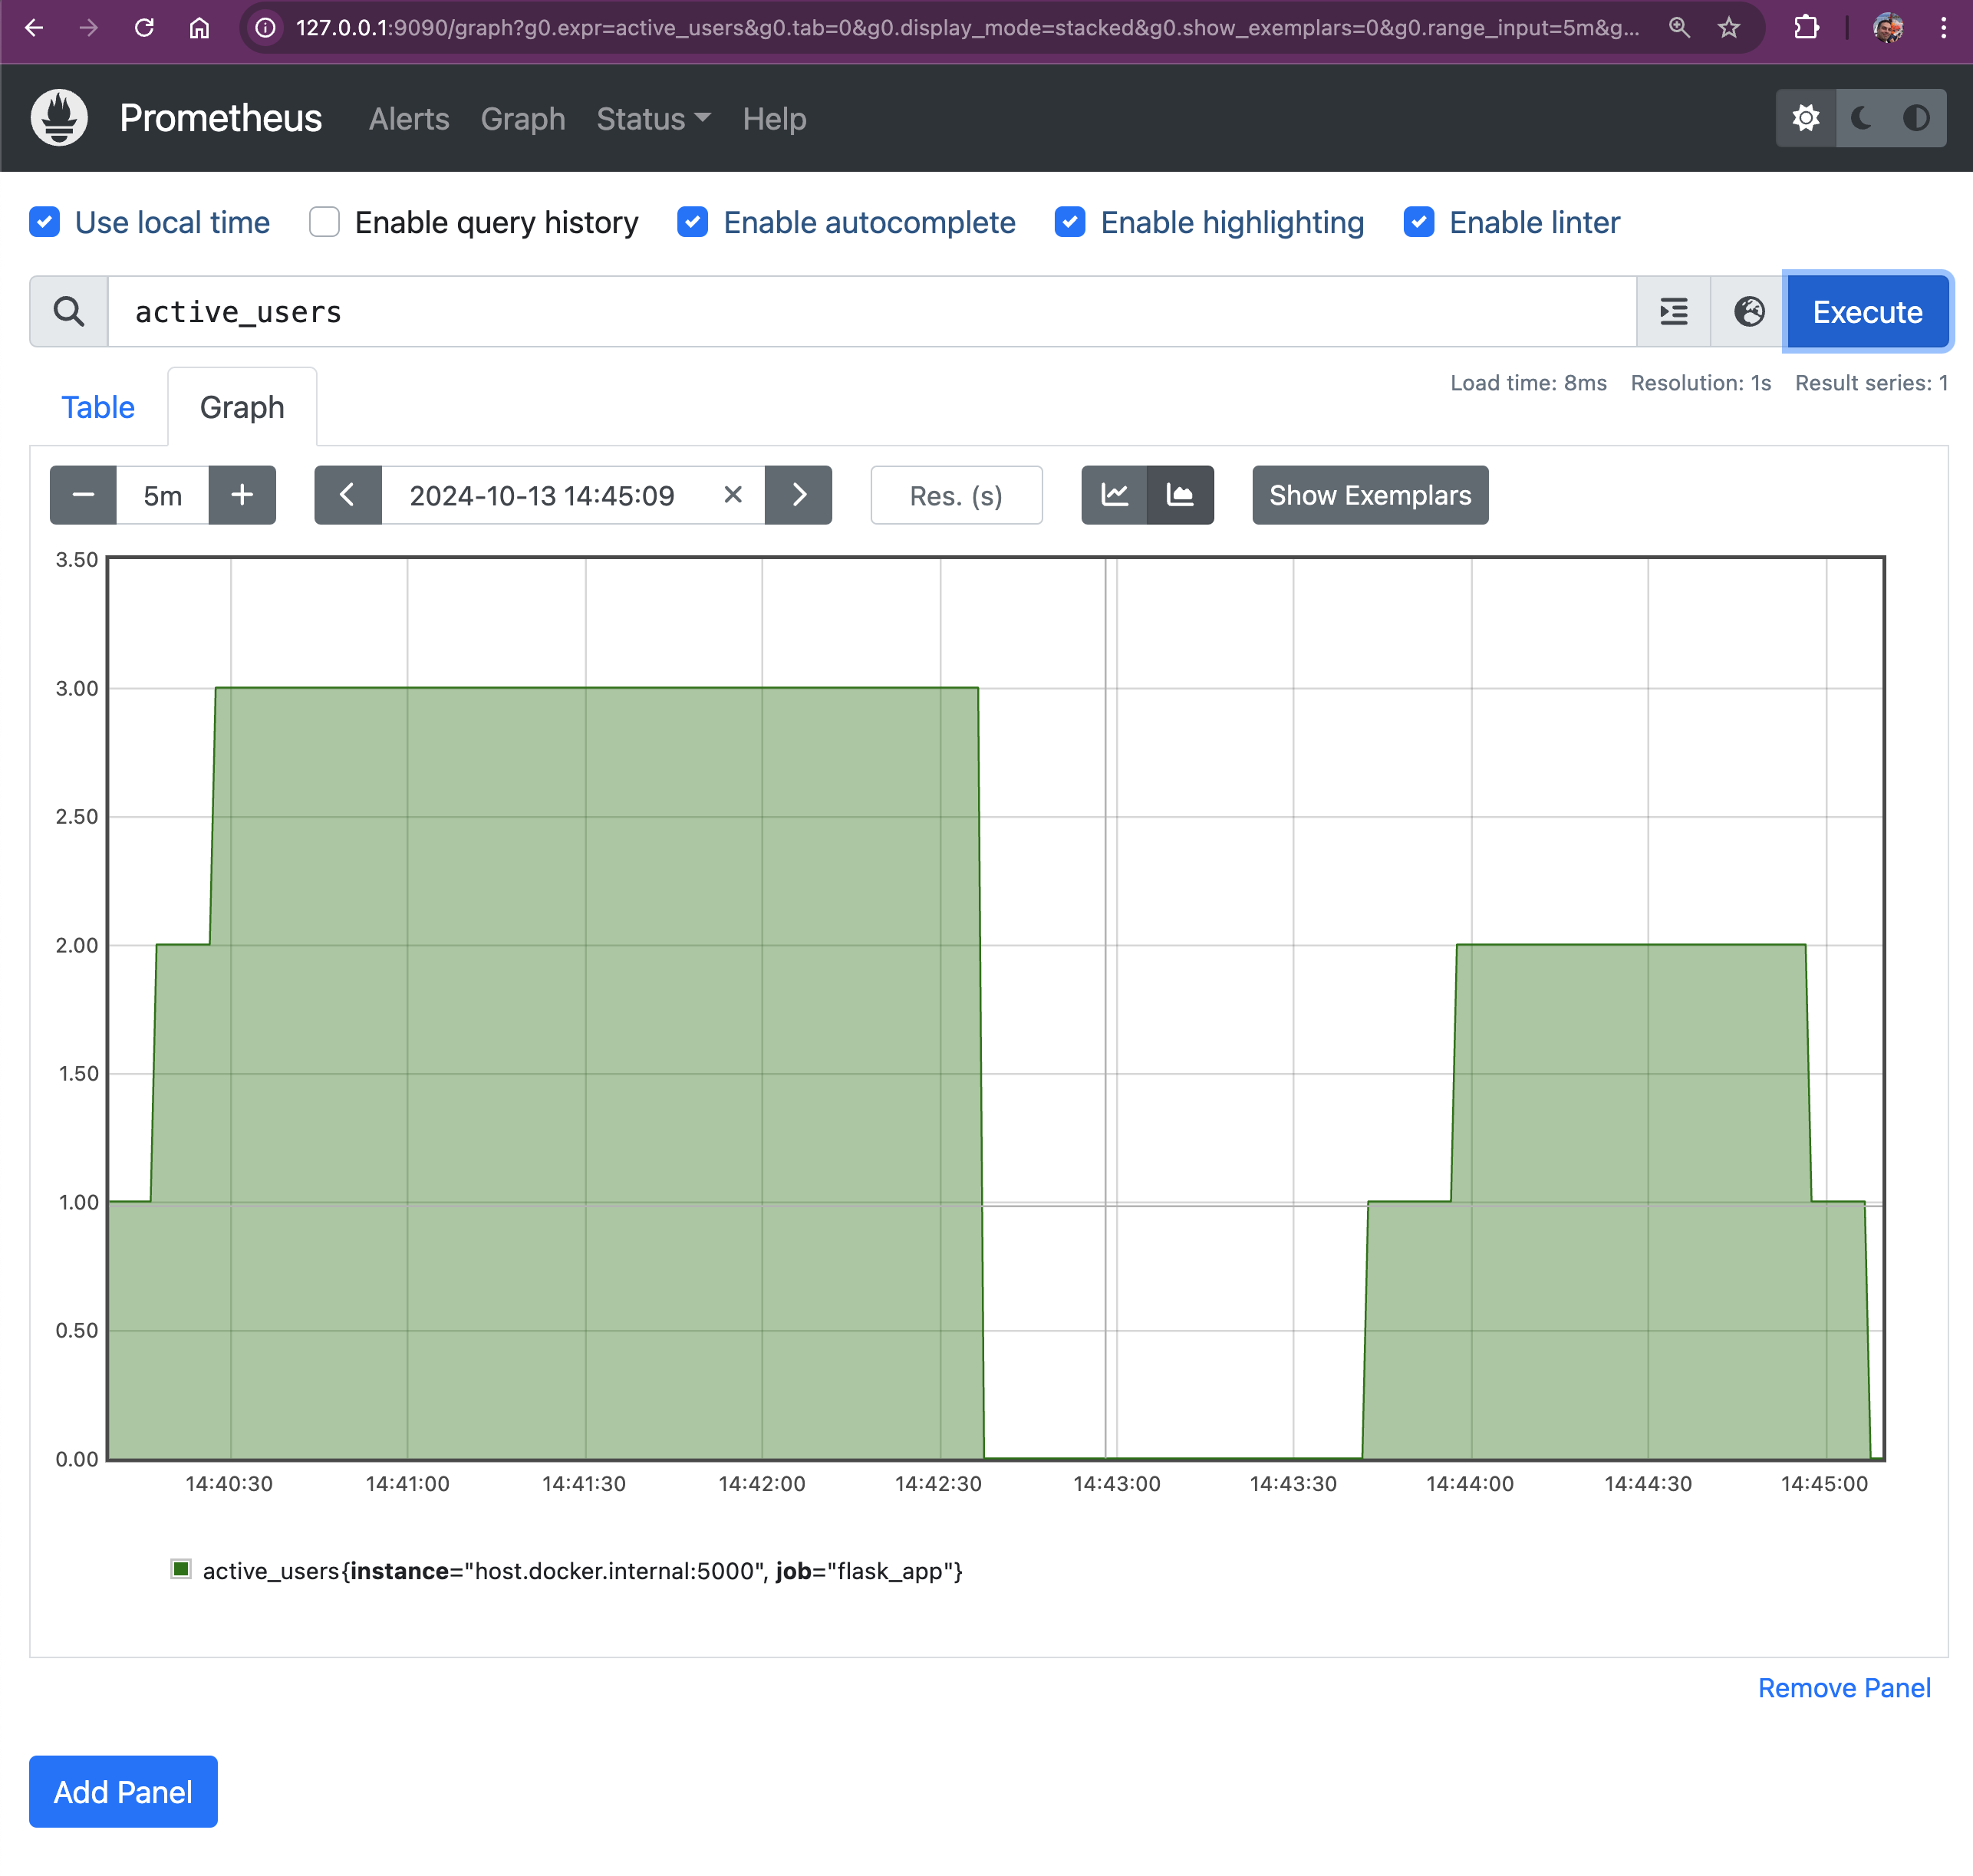
Gauges show fluctuating values, so you’ll see how many users are currently online, as this metric will go up and down over time.
The ACTIVE_USERS Gauge tracks the number of currently active users by incrementing when a new user session starts and decrementing when the session times out after 60 seconds of inactivity. Flask assigns a unique user_id to each session, stored server-side using Flask-Session. By monitoring user activity and session expiration, Flask keeps track of unique users during their visit, ensuring that repeated requests or page refreshes don’t count as new sessions.
if "user_id" not in session:
    with session_lock:
        session["user_id"] = str(uuid.uuid4())  # Assign unique ID to new user
        active_sessions[session["user_id"]] = time.time()  # Track the active session
        ACTIVE_USERS.inc()  # Increment active users when a new session starts
        logging.info(f"New user added: {session['user_id']}")
        session.modified = True  # Ensure session is saved
When a user accesses the site for the first time, Flask checks if user_id exists in the session.
If not, a new user_id is generated using uuid.uuid4(), and the session is tracked in active_sessions.
ACTIVE_USERS.inc() increments the active user count when a new session is created.
session.modified = True ensures the session is properly saved and persisted across requests.
If the user already has a session, their last active time is updated in active_sessions each time they make a request, keeping their session alive:
def session_cleanup():
    while True:
        time.sleep(10)  # Run the cleanup task every 10 seconds
        current_time = time.time()
        with session_lock:
            inactive_users = []
            for user_id, last_active in list(active_sessions.items()):
                if current_time - last_active > session_timeout:  # If user is inactive
                    inactive_users.append(user_id)
            for user_id in inactive_users:
                del active_sessions[user_id]  # Remove inactive users
                ACTIVE_USERS.dec()  # Decrement active users
                logging.info(f"User {user_id} removed from active sessions.")
A separate thread runs session_cleanup() to periodically check for inactive users every 10 seconds.
If the difference between the current time and the user’s last active time exceeds session_timeout (60 seconds), the user is considered inactive and removed from active_sessions.
ACTIVE_USERS.dec() decrements the active user count when users are removed due to inactivity.
def session_cleanup():
    while True:
        time.sleep(10)  # Run the cleanup task every 10 seconds
        current_time = time.time()
        with session_lock:
            inactive_users = []
            for user_id, last_active in list(active_sessions.items()):
                if current_time - last_active > session_timeout:  # If user is inactive
                    inactive_users.append(user_id)
            for user_id in inactive_users:
                del active_sessions[user_id]  # Remove inactive users
                ACTIVE_USERS.dec()  # Decrement active users
                logging.info(f"User {user_id} removed from active sessions.")
Simulating Checkout Duration with Histograms and Calculating Quantiles
In our Space Grocery Shop, we want to simulate different delays for different pace monkey customers. This will help us track how long the checkout process takes in different scenarios. We’ll add artificial delays—random durations—to simulate variability in checkout times, and use Prometheus Histograms to observe these delays.
Let’s modify our Flask app to introduce random delays between 1 and 10 seconds:
import random
import time


CHECKOUT_DURATION_HISTOGRAM = Histogram(
    'checkout_duration_seconds',
    'Histogram of checkout durations in seconds',
    buckets=[0.5, 1, 2.5, 5, 7.5, 10]
)

@app.route('/', methods=['GET', 'POST'])
def home():
    space_banana_price = 5
    if request.method == 'POST':
        random_checkout_duration = random.uniform(1, 10)
        logging.info('Space Banana purchasing request')
        SPACE_BANANA_SALES.inc(space_banana_price)  # Increase revenue

        with CHECKOUT_DURATION_HISTOGRAM.time():
            # Simulate the checkout process taking some time
            time.sleep(random_checkout_duration)
            SPACE_BANANA_PURCHASES.inc()

    ACTIVE_USERS.inc()  # Increase the number of active users
    return render_template_string("""
        <h1>Welcome to the Space Grocery Shop!</h1>
        <p>We sell Space Bananas, loved by space monkeys everywhere!</p>
        <form method="post">
            <button type="submit"><b>Buy Space Banana</b></button>
        </form>
        <p>Total Space Bananas Sold: {{ bananas_sold }}</p>
    """, bananas_sold=SPACE_BANANA_PURCHASES._value.get())
Why Are We Doing This?
By adding time.sleep(random_checkout_duration), we’re simulating real-world scenarios where the checkout process takes varying amounts of time due to different factors. The CHECKOUT_DURATION_HISTOGRAM records these durations, allowing us to analyze the distribution of checkout times.
Understanding Histograms in Prometheus
In Prometheus, Histograms are used to observe and record the distribution of values, such as response times or latencies. The data is divided into predefined “buckets,” and each bucket counts the number of observed events that fall into a specific range. Each bucket is labeled with le (“less than or equal to”), which defines the upper bound for that bucket.
Buckets Defined in Our Histogram:
buckets=[0.5, 1, 2.5, 5, 7.5, 10]These buckets help us categorize the checkout durations into meaningful ranges.
You can verify that your application is exposing the metrics by visiting:
http://127.0.0.1:5000/custom-metrics

Output:
# HELP checkout_duration_seconds Histogram of checkout durations in seconds
# TYPE checkout_duration_seconds histogram
checkout_duration_seconds_bucket{le="0.5"} 0.0
checkout_duration_seconds_bucket{le="1.0"} 0.0
checkout_duration_seconds_bucket{le="2.5"} 12.0
checkout_duration_seconds_bucket{le="5.0"} 17.0
checkout_duration_seconds_bucket{le="7.5"} 17.0
checkout_duration_seconds_bucket{le="10.0"} 17.0
checkout_duration_seconds_bucket{le="+Inf"} 17.0
checkout_duration_seconds_count 17.0
checkout_duration_seconds_sum 34.19696058500449
# HELP checkout_duration_seconds_created Histogram of checkout durations in seconds
# TYPE checkout_duration_seconds_created gauge
checkout_duration_seconds_created 1.7288061738952289e+09
Querying the Histogram Buckets
When Prometheus scrapes /custom-metrics endpoint, it collects the histogram data, including the counts of observations that fall into each bucket. We can query the buckets using this PromQL query:
checkout_duration_seconds_bucketThis query shows how many checkouts fell within each duration bucket.
This query shows how many checkouts fell within each duration bucket.
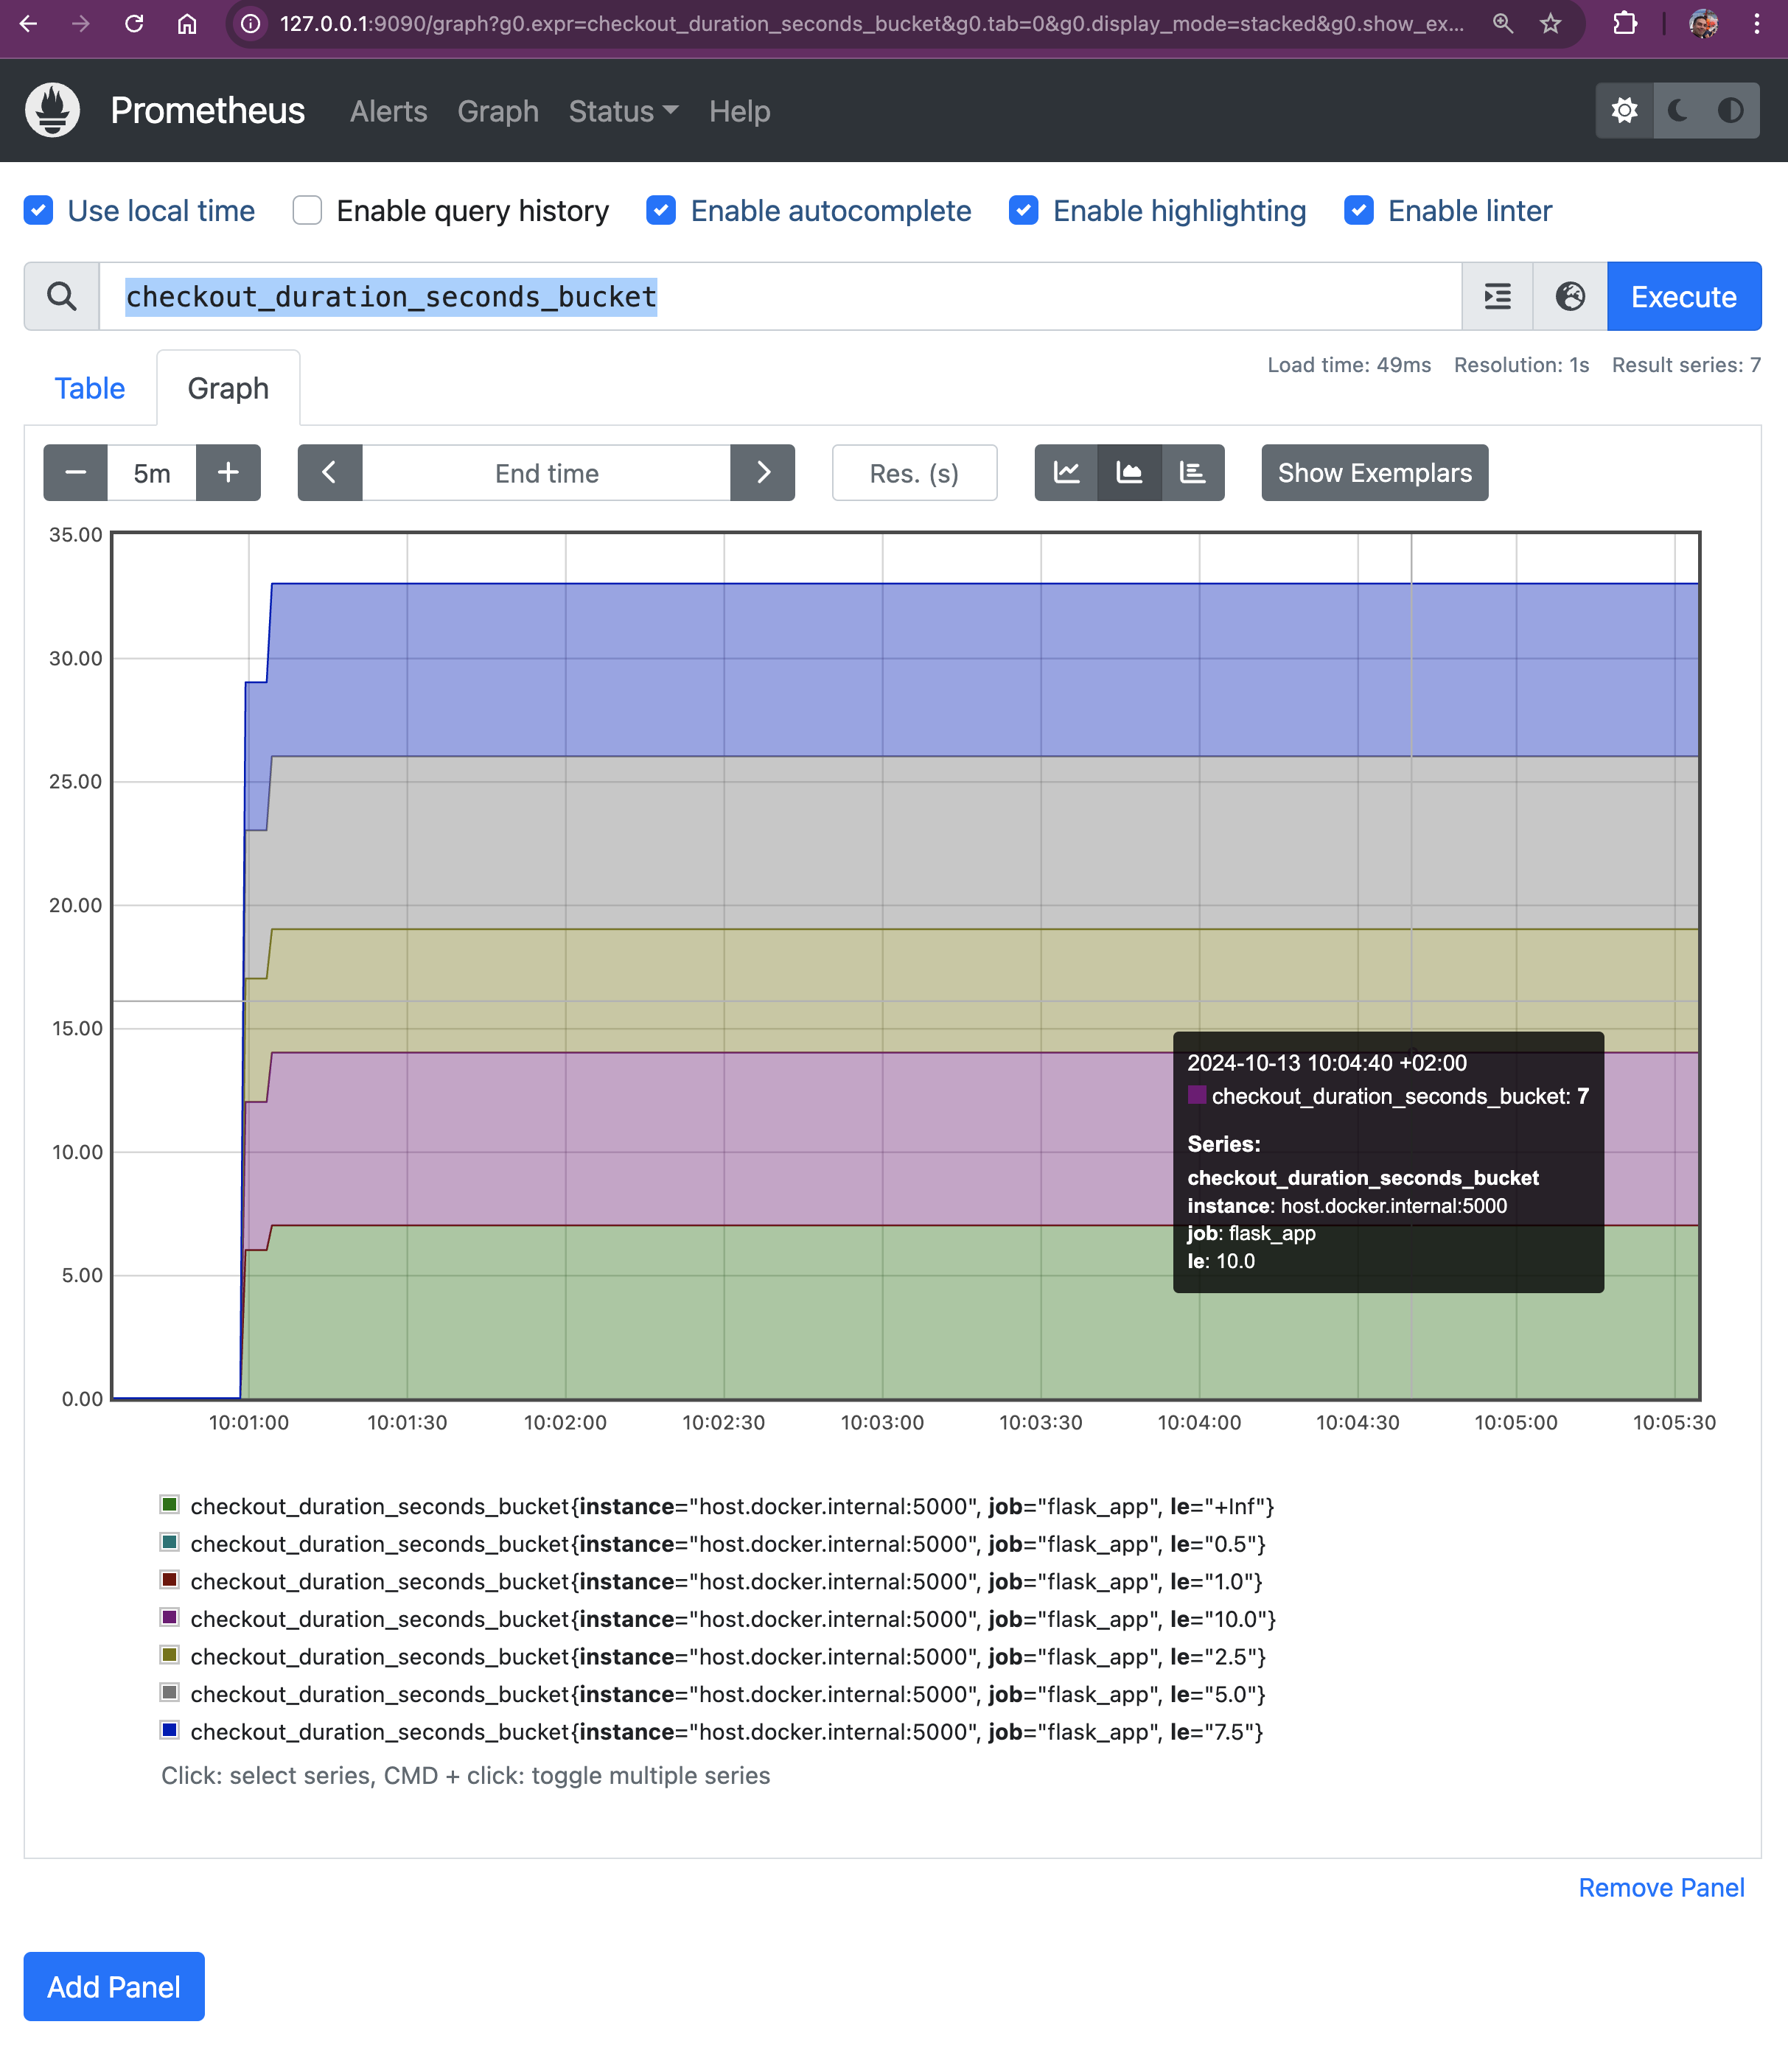 Let's break it down:
- le="+Inf": This bucket includes all requests, regardless of duration (i.e., all requests that have been completed).
- le="0.5": Includes all requests that took less than or equal to 0.5 seconds.
- le="1.0": Includes all requests that took less than or equal to 1 second.
- le="2.5": Includes all requests that took less than or equal to 2.5 seconds.
- le="5.0": Includes all requests that took less than or equal to 5 seconds.
- le="7.5": Includes all requests that took less than or equal to 7.5 seconds.
- le="10.0": Includes all requests that took less than or equal to 10 seconds.
Calculating Quantiles Using Histograms
Prometheus allows us to calculate quantiles from histogram data using the histogram_quantile() function. This function estimates quantiles based on the observed counts in the histogram buckets.
Example Prometheus Queries:
Calculate the 90th Percentile (P90) Checkout Duration:
histogram_quantile(0.90, rate(checkout_duration_seconds_bucket[5m]))Output:
{instance="host.docker.internal:5000", job="flask_app"}
4.166666666666667
Calculate the 99th Percentile (P99) Checkout Duration:
histogram_quantile(0.99, rate(checkout_duration_seconds_bucket[5m]))Output:
4.916666666666666histogram_quantile(x, rate(metric_bucket[window]))- The quantile you want to calculate (e.g., 0.90 for the 90th percentile).
rate(metric_bucket[window]): The per-second rate of increase for each bucket over the specified time window (e.g., [5m] for 5 minutes).
Why Histograms Matter
Using histograms allows us to visualize the distribution of checkout times across different ranges. By querying and analyzing this data, we can understand the performance of our application. For example, we can determine if most checkouts are fast (under 0.5 seconds), or if there are frequent slowdowns (e.g., checkouts taking 5 seconds or more).
Understanding Prometheus Summary Metric and Querying Quantiles: Summary Metric
In Prometheus, both Histograms and Summaries are used to observe and record the distribution of values, such as response times or latencies. However, there’s an important distinction when using the Python prometheus_client library:
- The Summary metric in Python does not support client-side quantile calculation.
- The Histogram metric allows us to calculate quantiles server-side using Prometheus queries.
Why Histograms Instead of Summaries in Python?
The Python prometheus_client library intentionally omits quantile calculations in the Summary metric due to performance considerations. Calculating quantiles client-side can be resource-intensive and is not efficient in high-load scenarios.
Therefore, to achieve quantile calculations with Python, we should use Histograms and leverage Prometheus’ powerful querying capabilities to compute quantiles on the server side.
Summary Metrics - Why We Don’t Use Summary Metrics in Python
In our way to monitor the performance of our Space Grocery Shop app, we considered using Prometheus’ Summary metric type to measure checkout durations and calculate quantiles like the median, 90th percentile, etc. However, we will not do it due to some limitations in prometheus_client.
The primary reason we don’t use Summary metrics is that the Python prometheus_client library does not support quantile calculations for Summary metrics. This limitation arises from intentional design decisions made by the library’s developers to avoid performance issues associated with client-side quantile calculations. The Summary metric in Python only tracks the count and sum of observations. It does not calculate quantiles like the median or percentiles. : Calculating quantiles on the client side can be resource-intensive and inefficient, especially under high load. To maintain performance, the Python client library omits this feature.
While Summary metrics might seem like an appropriate choice for calculating quantiles, the limitations in the Python prometheus_client library make them unsuitable for our needs. By using Histograms and leveraging Prometheus’ server-side capabilities, we can monitor our application’s performance and get insights anyway.
if you have any other opinion about this, please drop a comment below.
Final Thoughts
In this hands-on exploration of Prometheus and Docker, we’ve set up a monitoring system for a fun Space Grocery Shop app. Along the way, we’ve demonstrated how to collect key business metrics using Prometheus. From customizing the Prometheus configuration to tracking active users and sales via counters, we've implemented valuable monitoring capabilities. This setup, with persistent storage and real-time metric scraping, ensures that you can monitor your app’s performance.
Whether it's keeping an eye on CPU usage or ensuring you don’t miss any Space Banana sales, Prometheus proves to be an invaluable tool for maintaining and improving your system. As you continue working with Prometheus, the ability to query and visualize metrics will help you optimize your app and catch any issues before they escalate.
Happy Monitoring, space monkeys!