
Mastering Kubernetes Health Checks: Probes for Application Resilience - Part 1 out of 3
Introduction
If you run a mission-critical application, you need a robust health check mechanism to ensure the reliability of your workload.
Applications can fail for various reasons, including misconfiguration, application errors, or connectivity issues between the application and its database.
If you're running your application in Kubernetes, there’s no reason not to take advantage of the built-in probes. Understanding and correctly using Kubernetes probes enhances application resilience and reliability. Probes ensure that only healthy instances receive traffic and automate recovery processes, such as restarting the application. This helps maintain high availability even when issues arise.
In this series, we will implement a Go application that simulates and triggers different probes. By the end, you will have learned:
-
The importance of Kubernetes probes in automating health checks, contributing to more resilient and reliable applications.
-
The different types of probes: Startup, Readiness, and Liveness, each serving a distinct role in an application’s lifecycle.
-
How to implement these probes in your application deployment.
Requirements
To follow along, ensure you have the following:
-
A Kubernetes cluster.
-
A container registry to push and pull images
-
Docker daemon and Docker CLI installed locally to build images.
What Are Kubernetes Probes?
Probes are Kubernetes mechanisms for performing health checks on applications. The Kubelet is responsible for ensuring that containers within pods are running and healthy. It monitors the Readiness, Liveness, and Startup probes defined in pod specifications and takes appropriate actions based on probe results.
Without probes, Kubernetes assumes all containers are healthy once they start. Kubernetes can still restart containers if they crash or exit unexpectedly, but it lacks insight into conditions like responsiveness or readiness. As a result, unhealthy containers might continue receiving traffic, potentially impacting application stability.
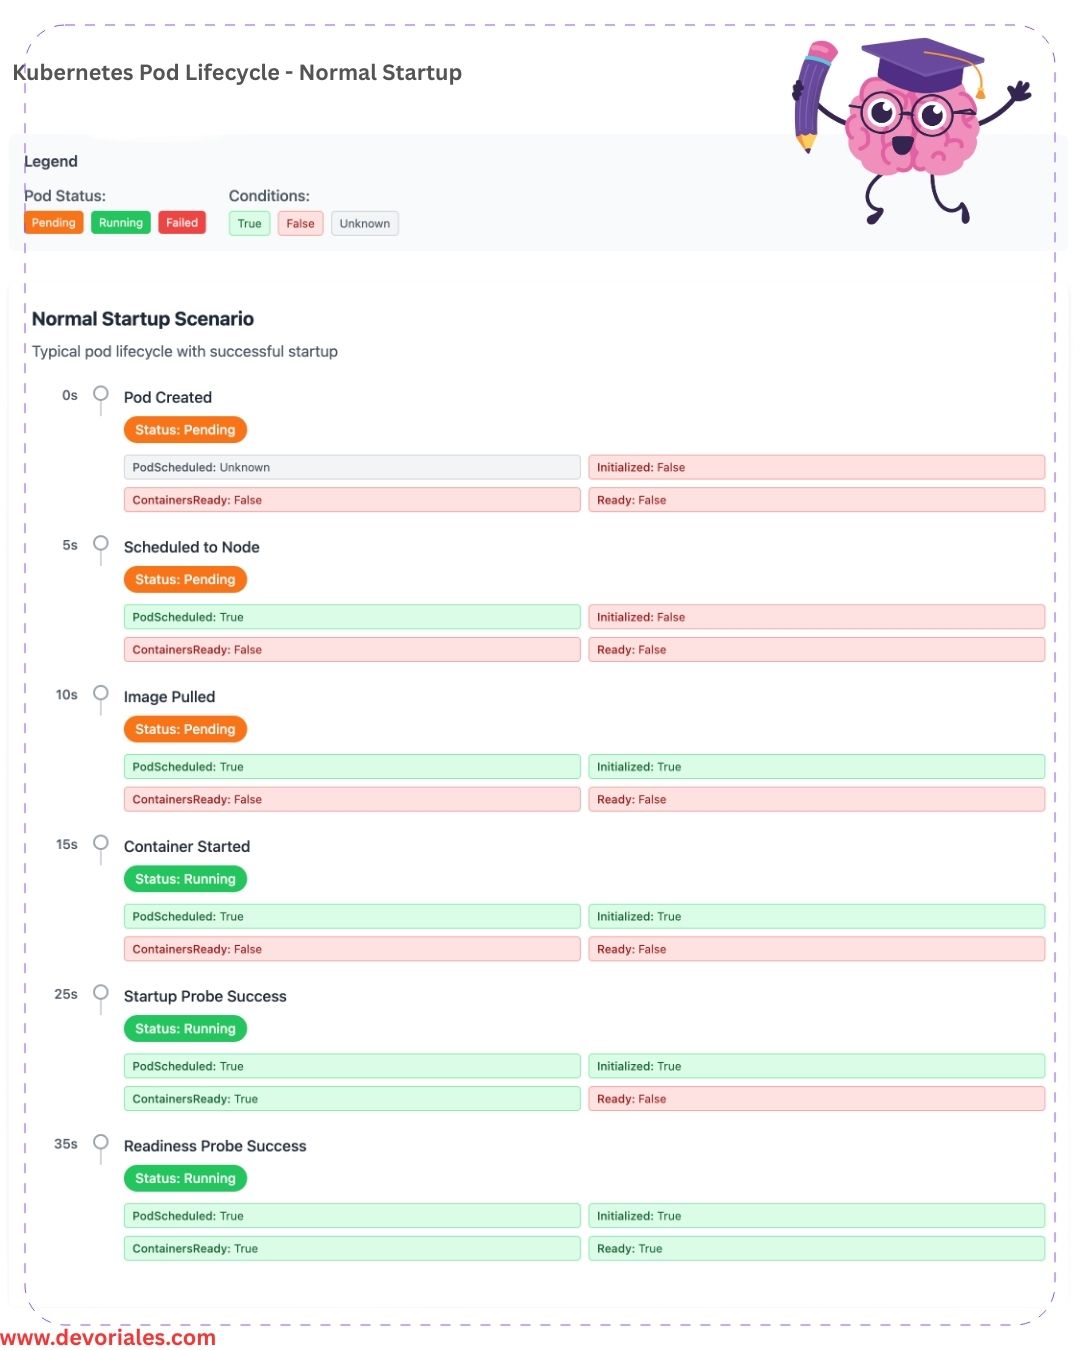
Pod Status and Pod Conditions
Before getting into probes, it's good to understand the Pod lifecycle.
Pod Status
Pods are the smallest deployable units in Kubernetes, representing a group of one or more containers. Each pod follows a lifecycle, with Kubernetes tracking and reporting its state through Pod Status and Pod Conditions.
Check out the following carousel to learn more about the Kubernetes Pod Lifecycle
Pod status phases
-
Pending: The pod has been accepted by the Kubernetes system, but one or more container images are not yet ready.
-
Running: The pod has been scheduled to a node, and all containers have started.
-
Succeeded: All containers in the pod have terminated successfully, and the pod will not restart. This is mostly related to Jobs.
-
Failed: At least one container in the pod has terminated with an error, and the pod is not restartable.
-
Unknown: The state of the pod cannot be determined, often due to a lack of communication with the node hosting the pod.
Pod Conditions
kubectl describe <pod-name> command:Conditions:
Type Status
PodReadyToStartContainers True
Initialized True
Ready True
ContainersReady True
PodScheduled TruePodReadyToStartContainers: This condition typically indicates that the pod has reached the point where it is ready to start initializing containers. This is part of the pod’s initialization lifecycle and ensures prerequisites like network setup and volume attachment are complete. Please note that this is a newer condition that was introduced in Kubernetes versions (v1.20+)Initialized: This condition is set to True once all the pod’s initialization tasks are complete, such as running initContainers (if any). It signals that the pod is ready to begin running its application containers.Ready: This condition indicates whether the pod is ready to serve traffic and handle requests. If True, all the necessary readiness probes (if configured) for containers have passed, and the pod is considered operational.ContainersReady: This condition signifies that all containers in the pod have passed their liveness and readiness probes and are ready to run or serve traffic. This is slightly more granular than Ready, as it focuses on the state of individual containers within the pod.PodScheduled: This condition shows whether the pod has been successfully scheduled to a node. A True value means the Kubernetes scheduler has assigned the pod to a node.
Types of Probes
Kubernetes offers three types of probes (at the time of this writing), each designed to monitor a specific aspect of a pod's lifecycle and operational state.
The following diagram is visualizing the role of each probe and how they interplay:
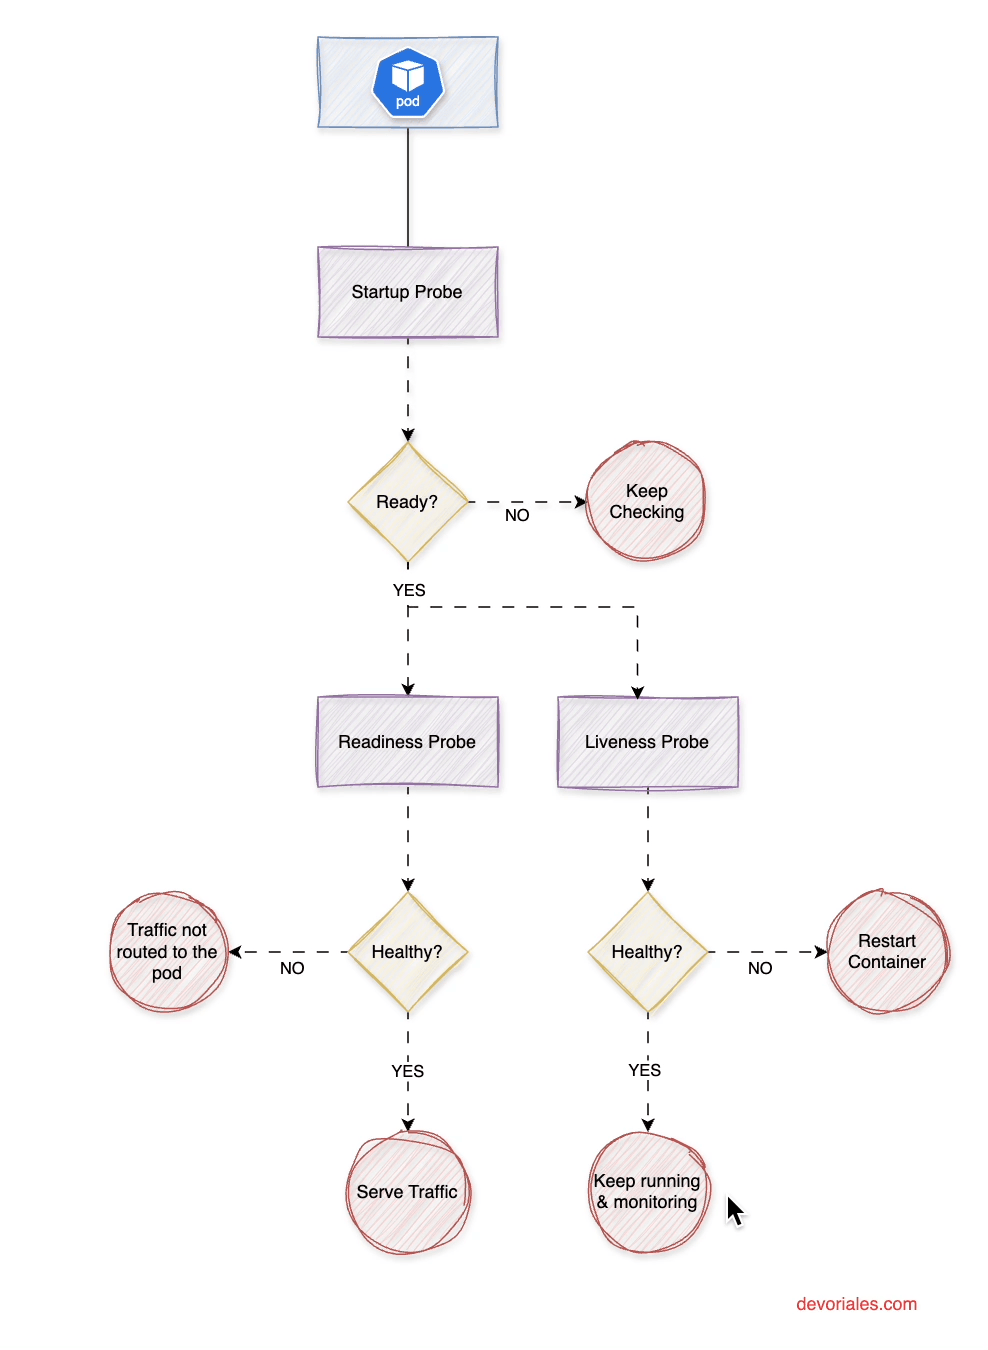
Startup Probe runs continuously with periodSeconds until it achieves successThreshold consecutive successes (always 1). It only executes during the container startup phase. Once successful, it stops permanently and enables liveness/readiness probes. If it reaches failureThreshold consecutive failures, Kubernetes restarts the container.
Liveness and Readiness Probes remain disabled during startup probe execution. Once the startup probe succeeds (or if no startup probe exists), they begin running continuously at their specified intervals throughout the container's lifecycle.
Startup Probes
Startup probes are useful for applications that require a long initialization time. Unlike liveness probes, which check application health during runtime, a startup probe prevents premature restarts by giving the application time to fully start before Kubernetes begins liveness and readiness checks.
Example Use Case
A complex application requires significant time to load its configuration and data. The startup probe allows it to start without unnecessary restarts.
Readiness Probes
Readiness probes determine if a pod is ready to accept traffic. They are useful when an application might be running but still initializing dependencies. If a readiness probe fails, the container's endpoint stops receiving the traffic and if all containers in a pod fail their readiness probes, then the pod is removed from the service endpoint targets.
Example Use Case
A database-driven application requires a warm-up period before handling requests. The readiness probe ensures that it does not receive traffic prematurely. Since the readiness probe runs periodically throughout the workload lifecycle, it can also remove a previously healthy workload from the service.
Liveness Probes
Liveness probes check whether an application is still running. If an application enters an unrecoverable state (e.g., deadlock), the liveness probe detects this and triggers a restart. Since the liveness probe runs periodically throughout the workload lifecycle, it can also restart a previously healthy container.
Example Use Case
A web server is stuck in an infinite loop and unable to serve new requests. A liveness probe can detect this and restart the container.
What component in Kubernetes is responsible for probes?
The kubelet is the component responsible for maintaining the health and availability of containerized applications through the use of probes. As a node-level agent, the kubelet manages container health by running probes such as liveness, readiness, and startup probes, ensuring that containers are functioning properly and ready to serve traffic.
Configuration and Parameters
Each probe type can be configured using HTTP GET requests, TCP socket checks, or by executing commands inside the container. The following parameters help fine-tune the behavior of probes to adapt to various operational requirements:
| Property | Type | Default | Description | Notes |
|---|---|---|---|---|
initialDelaySeconds |
integer | 0 | Number of seconds after container start before probe is initiated | If periodSeconds > initialDelaySeconds, initialDelaySeconds is ignored |
periodSeconds |
integer | 10 | How often (in seconds) to perform the probe | Min 1 |
timeoutSeconds |
integer | 1 | Number of seconds after which the probe times out | Min 1 |
successThreshold |
integer | 1 | Minimum consecutive successes for probe to be considered successful after failure | Must be 1 for Readiness and Startup Probes |
failureThreshold |
integer | 3 | Number of times probe must fail before container is considered unhealthy | Min 1 |
terminationGracePeriodSeconds |
integer | 3 | Grace period for kubelet to wait before forcing container stop | Cannot be set for readiness probes. Available in v1.28+ |
Probe Termination Grace Period
When a probe failure triggers a container restart, Kubernetes doesn't immediately kill the container. Instead, it gives the container a grace period to shut down gracefully.
This termination grace period is controlled by the terminationGracePeriodSeconds field in the pod specification (default is 30 seconds). During this time, the container can save state, complete ongoing requests, or perform cleanup operations before being forcibly terminated. This graceful shutdown process helps maintain application stability and prevents data loss, especially important for stateful applications or those processing critical operations.
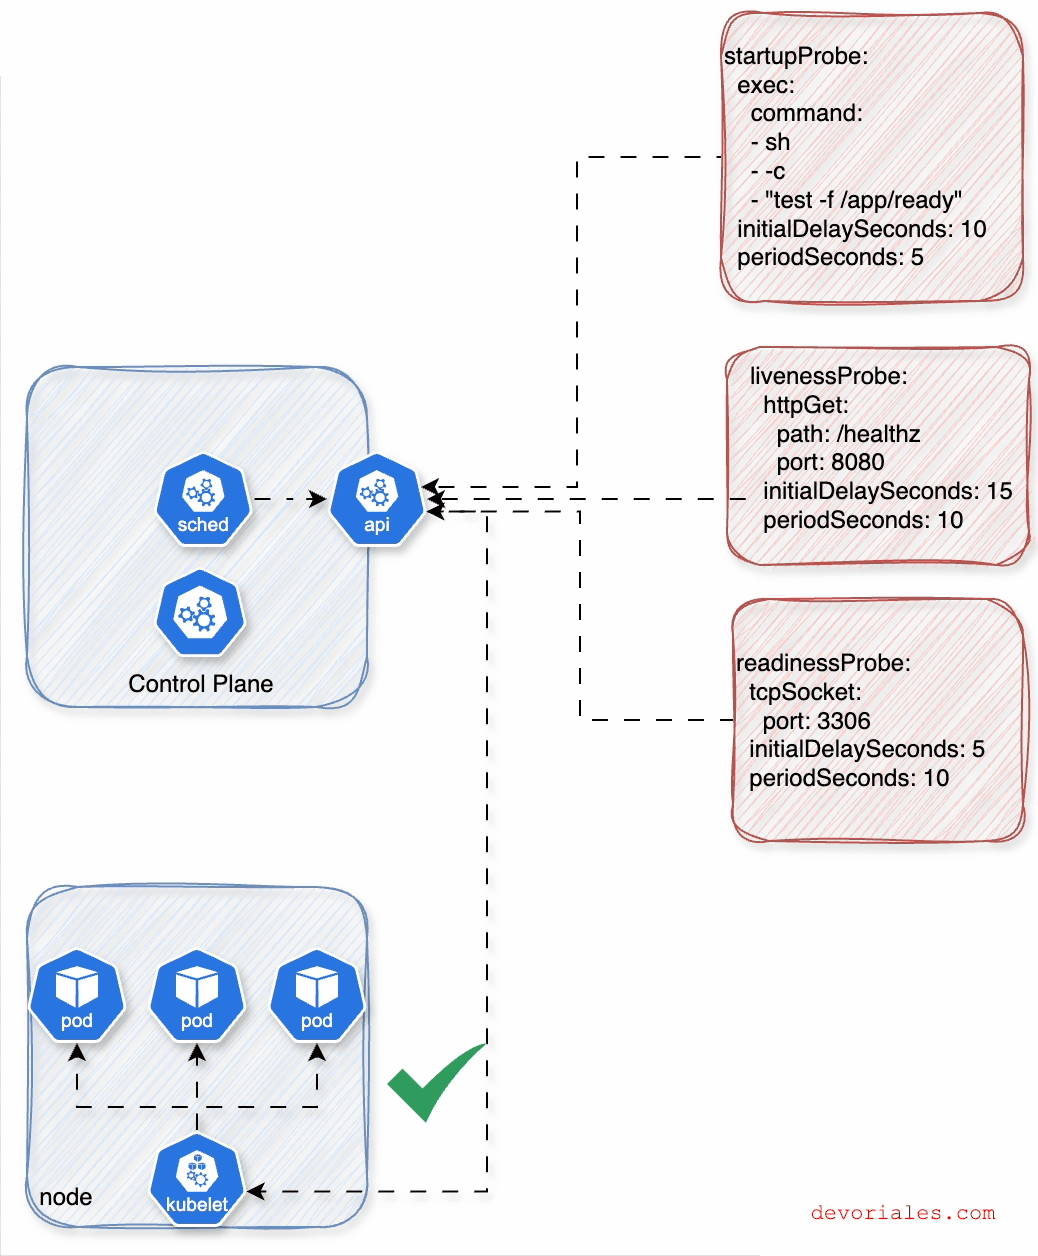
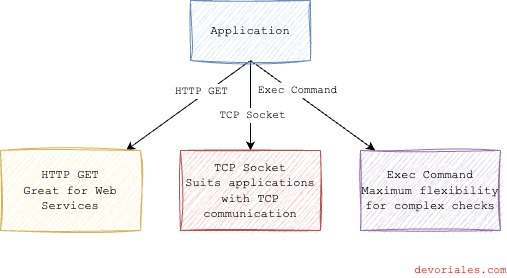
Mechanisms for Kubernetes Probe Checks - HTTP GET, TCP Socket or Command
While Kubernetes distinguishes between three types of probes (Startup, Readiness, and Liveness) based on their roles in the application lifecycle, the method by which these probes assess container states is equally important. Each probe type can utilize one of three mechanisms to perform its checks: HTTP GET, TCP Socket, and Exec Command. Understanding these mechanisms is crucial for configuring probes effectively in your Kubernetes deployments.
HTTP GET
HTTP GET is the go-to method for services that communicate over HTTP. Kubernetes sends an HTTP GET request to a specific path and port on the container. The probe is considered successful if the response has a status code in the 200-399 range (this range is configurable using the httpGet.httpHeaders field). This mechanism is ideal for web applications and RESTful APIs where an HTTP endpoint can reliably indicate the application's health.
Example Configuration:
livenessProbe:
  httpGet:
    path: /healthz
    port: 8080
  initialDelaySeconds: 15
  periodSeconds: 10
TCP Socket
TCP Socket are used for checking the availability of services that listen on a TCP port. This mechanism attempts to establish a TCP connection on the specified port of the container. Success is determined by the ability to establish the connection. TCP probes are useful for applications that might not speak HTTP but still use network communication, such as databases or application servers.
Example Configuration:
readinessProbe:
  tcpSocket:
    port: 3306
  initialDelaySeconds: 5
  periodSeconds: 10
Exec Command
Exec Command executes a command inside the container and considers the probe successful if the command exits with a status code of 0. This flexible mechanism allows for custom health checks, such as verifying the presence of a file, checking local processes, or any other criteria that can be assessed with a shell command. It's particularly useful when neither HTTP nor TCP checks are applicable.
Example Configuration:
startupProbe:
  exec:
    command:
    - sh
    - -c
    - "test -f /app/ready"
  initialDelaySeconds: 10
  periodSeconds: 5
What mechanism should you choose?
Choosing the right mechanism depends on your application's architecture and the nature of the health check required.
HTTP GET is straightforward for web services, TCP Socket suits applications with TCP communication, and Exec Command offers maximum flexibility for complex or non-standard health checks. By tailoring the probe mechanism to your application's needs, you ensure Kubernetes can accurately assess and manage your container's health and availability.
❗In this tutorial, we'll demonstrate all three mechanisms to illustrate their capabilities.
When setting up probes, consider these best practices:
Timing Parameters
- For slow-starting applications (like Java applications with large JARs), set longer `initialDelaySeconds` (e.g., 60-120 seconds)
- Microservices typically need shorter delays (5-15 seconds)
- Adjust
timeoutSecondsbased on expected response times (database queries might need 5-10 seconds) - Set
periodSecondsto balance responsiveness with resource usage (10-30 seconds is common)
Threshold Settings
- Use
failureThreshold: 3for liveness probes to avoid premature restarts - Set
successThreshold: 1for most cases (higher values are rarely needed) - Consider higher failure thresholds for readiness probes if your application has temporary hiccups
Application-Specific Considerations
- Database applications: Use longer timeouts and higher failure thresholds
- Stateful applications: Configure longer termination grace periods
- High-traffic services: Use shorter periods for quicker detection of issues
A few Questions For You To Answer
- What are the three types of probes in Kubernetes, and what is the primary purpose of each?
- Explain the default behavior of Kubernetes regarding container health when no probes are specified. What are the potential implications of this default behavior?
- Describe the three mechanisms Kubernetes uses to perform probe checks. In which scenarios would each mechanism be most appropriate?
- How does the Startup Probe differ from the Liveness and Readiness Probes in terms of execution and use-case?
- Which component in Kubernetes is responsible for executing probes, and how does it contribute to managing container health and availability?
Continue reading Part 2 of this three-part series about the Kubernetes probes.