
K8s Horizontal Pod Autoscaler
K8s Horizontal Pod Autoscaler
Introduction
In this article, we will discuss how to create a HorizontalPodAutoscaler (HPA) based on targetAverageUtilization. Additionally, we will provide an introduction to scaling based on custom metrics.
While there is a good official article that describes how HPA works, our article will simplify things with a use case to make it more digestible
A link to the official documentation can be found here.
What is targetAverageUtilization?
targetAverageUtilization is a configuration parameter used in Horizontal Pod Autoscaling (HPA) in Kubernetes. It specifies the target average CPU utilization percentage across all pods for a given deployment or statefulset. The HPA controller periodically checks the CPU utilization metrics of the pods and adjusts the number of replicas to maintain the specified target average utilization.
For example, if the targetAverageUtilization is set to 80%, the HPA controller will try to maintain an average CPU utilization of 80% across all pods in the deployment or statefulset. If the CPU utilization exceeds the target, the controller will increase the number of replicas, and if it falls below the target, the controller will decrease the number of replicas.
By setting a target average utilization, the HPA controller can automatically adjust the number of replicas based on demand, ensuring that the deployment or statefulset has the appropriate resources to handle the current load.
Use case
Imagine you are a Kubernetes Administrator for an E-commerce company that serves millions of users. During Black Friday, the traffic to your site is expected to increase exponentially. The company's leadership has expressed that your E-commerce solution must be able to meet this increased demand since sales are significant for the company's annual revenue.
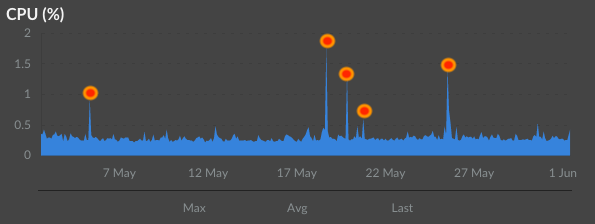
Based on historical data, you know that the company's eCommerce platform experiences resource spikes during Black Friday, which can cause slow traffic and result in sales loss, particularly in the morning hours for each time zone.
For example, CPU spikes can occur, and when they do, you need to scale your application to meet the demand. When the demand decreases, you need to ensure that workloads scale down accordingly.
The following diagram reflects the spikes that occur occasionally:
The following diagram shows a fictive design of the E-commerce solution that you're supporting, and it has three major components.

The e-com website is the web service that hosts the website itself. This is where all the pages run.
The Authentication Service is a microservice used for user authentication through OAuth.
The Payment Gateway microservice handles all payments by sending requests to a third-party payment service.
The worker nodes have sufficient CPU and memory capacity and do not require scaling.
You aim to ensure the services are running smoothly without outages and slow responses.
Possible Solutions
Solution 1 - Manually Setting Replicas:
One way to handle increased traffic is to measure the CPU and memory utilization and then set the pod replicas to an appropriate number to balance the traffic among running pods. However, this solution is relatively simplistic and may not meet demand depending on the calculations made for determining the required number of replicas. It is still essential to monitor the utilization and traffic, but manually adjusting replicas may not be the best solution.
Solution 2 - Implement Horizontal Pod Autoscaling (HPA) (Recommended):
In this example, we will use CPU utilization, but it is also possible to use memory or custom metrics as well. Kubernetes provides the ability to implement an HPA that can automatically scale the number of pods based on demand.
The HPA uses the Metrics API, which periodically checks metrics and performs autoscaling based on the HPA configuration. The default time interval for checking metrics is every 15 seconds, but this can be adjusted as necessary.
Horizontal Pod Scaling can impact the number of running pods, and the number of replicas may increase if the load increases (CPU and/or memory/custom metric). Conversely, if the load decreases, the HPA controller will evaluate the number of currently running pods, and if utilization is lower than specified and the number of pods is higher than the targetAverage specified in the HPA manifest, the number of replicas will decrease.
Requirements
Metrics-Server Introduction
To obtain metrics from a Kubernetes cluster, you need to install a metric server. This service is not part of the core implementation of Kubernetes.
It's important to note that the metric server is not a time-series database and therefore won't store any historical data. To store data, you would need to use a database like Prometheus, InfluxDB, VictoriaMetrics, or similar. The metric server's purpose is to provide immediate metrics, right now.
Furthermore, the metric server is not capable of performing sophisticated queries, and it doesn't provide a notion of acceleration or rate of change.
After deploying the metric server, you will have access to some useful graphs in the Kubernetes dashboard. However, this topic won't be covered in this particular article.
Metrics-Server Installation
- You need to install metrics-API to your cluster, which does not come by default. Follow the instructions here:
-
kubectl apply -f https://github.com/kubernetes-sigs/metrics-server/releases/latest/download/components.yaml- verify with
kubectl get --raw /apis/metrics.k8s.io/
- Set a resource request for the Deployment that will be autoscaled.
Where does HPA apply?
From the official doc:
The HorizontalPodAutoscaler is implemented as a Kubernetes API resource and a controller. The resource determines the behavior of the controller. The horizontal pod autoscaling controller, running within the Kubernetes control plane, periodically adjusts the desired scale of its target (for example, a Deployment) to match observed metrics such as average CPU utilization, average memory utilization, or any other custom metric you specify.
Horizontal Pod Autoscaling applies to Deployment and StatefulSet.
Also, the application should support scaling. For instance, databases are not easy to scale horizontally; you usually need to set them up in a recommended way.
Here is an example of how to configure HPA for Postgres:
https://www.bmc.com/blogs/kubernetes-postgresql/
Please note! Horizontal Pod Autoscaling does not apply to DaemonSet objects.
The CPU request that you need to configure is of significant importance for HPA.
In our example, we have set the CPU request to be 200 millicores (one-fifth of a CPU core). the limits and requests: How to Set Limits and Requests
The HPA will benchmark CPU usage based on the request specification.
- If the pod utilization is 400m, the HPA will treat usage at 200% of CPU usage.
- If the current usage is at 100m CPU, the HPA will treat usage at 50% of CPU usage.
The limit is the maximum CPU usage the Pod can utilize; in our case, the limit is 500m CPU (half of a CPU core). Not entirely relevant right now for calculation.
The manifest for the HorizontalPodAutoscaler has the following attributes (this is an example):
apiVersion: autoscaling/v1
kind: HorizontalPodAutoscaler
metadata:
  name: webapp
  namespace: ecom-service
spec:
  maxReplicas: 4
  minReplicas: 1
  scaleTargetRef:
    apiVersion: apps/v1
    kind: Deployment
    name: webapp
metrics:
- type: Resource
  resource:
    name: cpu
    targetAverageUtilization: 50
.spec.minReplicas: 1, which means this is the minimum number of pods that needs to run. Amount of replicas cannot go below this number.
.spec.maxReplicas: 4, which means this is the maximum number of pods that can run. Amount of replicas cannot go beyond this number.
spec.scaleTargetRef defines which Deployment to scale
metrics block defines the metric that the HPA will measure for pod scaling. We're using the Resource type metrics, but there are many others, and you should check the Kubernetes docs to find other metrics types.
targetAverageUtilization: 50 is a percentage value. The HPA will try to keep the average CPU utilization (among all pods that are currently running) close to 50%
The Autoscaler will bring up or down the number of pods to be close to 50% of CPU utilization.
The HorizontalPodAutoscaler will apply to the Deployment called web app:

When a targetAverageValue or targetAverageUtilization is specified, the currentMetricValue is computed by taking the average of the given metric across all Pods in the HorizontalPodAutoscaler's scale target.
The HPA controller will monitor the Deployment pods currently running to find an appropriate number of replicas based on current utilization.
The following formula can help understand how the desired replicas are calculated based on the current replicas and the current utilization:
desiredReplicas = ceil[currentReplicas * ( currentMetricValue / desiredMetricValue )]
The currentMetricValue should be the current CPU utilization in our case.
All pods taken into consideration has to be in a Ready state. Also, pods shutting down or not in a Ready state are removed from the calculation.
ceil = always rounds a number up to the next largest integer
example in Python so you can better understand how it's being calculated. It will always round up.
import math

math.ceil(1.33)

Output:
2
So let's have a look at our example: Our spec based on our Pod spec defined here has the following CPU request:
- Request 200m CPU
Here is an explanation from the official HPA document on how the HPA controller is performing the calculation:
Once during each period, the controller manager queries the resource utilization against the metrics specified in each HorizontalPodAutoscaler definition. The controller manager finds the target resource defined by the, then selects the pods based on the target resource's .spec.selector labels, and obtains the metrics from either the resource metrics API (for per-pod resource metrics) or the custom metrics API (for all other metrics).
targetAverageUtilization: 50
the benchmarking performs against 200m CPU request.
desiredReplicas = ceil[1*(200/200)] = 1
No change will occur when at 1, that's is a ratio reference value.
What happens if the load goes up to 300m CPU?
this is a 150% utilization increase.
How do we know it's a 150% increase? I'm going to use a simple formula that shows how much an increase in the percentage of the 300m CPU utilization compares to desired 200m CPU:
percentage increase = increase ÷ original number × 100; 300 / 200 * 100 = 150%
We will follow the formula for finding out desiredReplicas
currentMetricValue=300
desiredMetricValue=200
currentReplicas=1
desiredReplicas = ceil(1*(300/200)) = 1.5
So in our case, the number of pods will go from 1 to 2, the HPA will round this up.
What happens if the load goes up to 400m CPU?
currentMetricValue=400
desiredMetricValue=200
currentReplicas=2
Increase: 400/200*100 = 200%
Now let's calculate the number of pods based on the formula:
desiredReplicas = ceil[currentReplicas * ( currentMetricValue / desiredMetricValue )]
ceil(2*(400/200))= 4 pods
What if your demand is even higher?
It might be a little bit conservative to set maxReplicas only to 4. In the real-world scenario, that number would be significantly higher if you get massive traffic to your website.
Still, with a DDOS attack, your pods could scale to thousands if you don't set a maximum number of pods.
Also, I would recommend having targetAverageUtilization set to somewhat higher, like 80%, but not beyond that due to a cold start effect. Please read the next section.
Cold-start time - a real problem
It takes a while before a pod comes up and gets fully responsive. So you need to leave some offset for the running Pods before the new ones come up and get fully responsive.
If you set targetAverageUtilization to 100%, you would most likely end up with CPU throttling; your application would start responding slow, because it may take time before a new pod(s) is coming up.
For the memory resource, the running Pod would most likely get OOM:ed, once again, because the new pods and re-balancing the traffic can take a while and the current pods will not keep up within that time interval.
By keeping, let's say, 80%, your current pods can still serve the demand, and your new pods would have time to start up and get responsive to the traffic, giving them time to end up in a Ready state.
How to Set Limits and Requests
In Kubernetes, you need to configure Requests and Limits to control the resources available to your workloads.
Definitions:
- Request: is what is guaranteed for the container to get scheduled. Kubernetes will only schedule a pod on a node that has enough resources to fulfill the number you have specified in the request (CPU and Memory).
- Limit: max CPU or Memory that the container can utilize. If it exceeds the memory limit, the Pod gets OOM:ed. Regarding CPU, pods don't get killed, but CPU throttling significantly slows the application's response time.
If we assume the spec below, the pod will only get scheduled if there is a node with enough capacity to meet the CPU and Memory request specification. In our case, one-fifth of a CPU core, 200m.
If our Pod bumps up to or beyond 500m CPU, a CPU throttling will occur and your application will have poor performance. If the Pod hits the memory limit (not part of the spec), the Pod will get terminated (Out Of Memory or OOM) and another one will start. You need to make sure that your requests and limits are correctly configured based on your observations and performance testing.
Example of how to set request and limit for CPU you can configure the same limit and request for memory):
apiVersion: v1
kind: Pod
metadata:
  name: webapp
spec:
  containers:
  - name: app
    image: images.ecom.example/webapp:v1
    resources:
      requests:
        cpu: "200m"
      limits:
        cpu: "500m"
Scaling using Custom Metrics
What are custom metrics?
- Custom metrics are exposed through:
custom.metrics.k8s.ioAPI - Custom metrics are not Stored in Kubernetes directly, will be available though via Kubernetes API
- Examples of third party monitoring systems and adapters:
- Prometheus
- Amazon CloudWatch
- GCP Cloud's Operations Suite (former Stackdriver)
A diagram that illustrates Prometheus as a monitoring system and its adapter:

Assumption:
- Pods are emitting application metrics
- Prometheus format - endpoint in our example is
/metrics - Monitoring System (e.g., Prometheus) polls the exposed
/metricsendpoints - The Monitoring system stores the metrics, not Kubernetes
- Metrics Adapter
- communicates with a monitoring system
- acts as extended/aggregated API
- Kubernetes components can talk to the Metrics adapter directly
- external, but acts as Kubernetes native API and served by Kubernetes, looks native.
- HPA - targets the Deployment
- queries of the custom metric API in K8s API, checkef every 15 sec by default
- query results sent to Metrics adapter, which then proxies those requests to the, i.e., Prometheus Monitoring System
- will calculate the result based on the Pod bounds you have specified in the HPA manifest.
Example - Custom Metric Type: Pods
In this example, we have a custom metric called packets-per-second
apiVersion: autoscaling/v2beta2
kind: HorizontalPodAutoscaler
metadata:
  name: web-custom-metric-hpa
spec:
  scaleTargetRef:
    apiVersion: apps/v1
    kind: Deployment
    name: webapp
  minReplicas: 1
  maxReplicas: 4
  metrics:
  - type: Pods
    pods:
      metric:
        name: packets-per-second
      target:
        type: AverageValue
averageValue: 100- Type: Pods
- describes Pods
- Similar to the Resource Metric Type that we went through in the previous example
- Only supports target type: AverageValue
- the average result is calculated based on all Pods in the autoscaling group, part of our Deployment
- name:
packets-per-second; comes from the custom metrics API
Example - Custom Metric Type: Object
In this example, we're looking at Object type:
- Describes any object type
- Specified in the describedObject field
- Metric name is what's corresponding with the metric exposed by the adapter itself
- you need to specify the following:
- apiversion
- Kind
- Name
- you need to specify the following:
- Supports two types of targets:
- value : a number that gets returned by the Custom Metric API. It's in absolute number.
- averageValue: gets calculated by: value / amount of Pods
apiVersion: autoscaling/v2beta2
kind: HorizontalPodAutoscaler
metadata:
  name: webapp
  namespace: ecom-service
spec:
  scaleTargetRef:
    apiVersion: apps/v1
    kind: Deployment
    name: webapp
  minReplicas: 1
  maxReplicas: 4
  metrics:
    - type: Object
      object:
        metric:
          name: nginx_ingress_controller_requests_rate
        describedObject:
          apiVersion: extensions/v1beta1
          kind: Ingress
          name: ecom-service
        target:
          type: AverageValue
          averageValue: "10000"
Example - Filter queries based on Labels
For non-resource metric types (Pod, object, and external), you can refine your metric query by specifying an additional label selector.
It's very helpful when you're interested in a specific subset of a metric.
You could:
- refine your metrics query by simply passing labels to the monitoring system
- scale based on the subset of a specific metric
- Uses standard Kubernetes label selector
The following HPA manifest has a matchLabels added to the definition.
In the following HPA manifest, we have request-per-second that provides the total number of request-per-second, but what if we just want to scale number of replicas based on the number of HTTP GET requests? By adding a matchLabels section, we can pass a label to the monitoring system, which will return a value we're interested in.
The definition of the verb being passed to the monitoring system is something that the Metrics adapter defines, so you need to check the specification of a specific adapter.
Example: HTTP GET request-per-second metric
apiVersion: autoscaling/v2beta2
kind: HorizontalPodAutoscaler
metadata:
  name: web-custom-metric-hpa
spec:
  scaleTargetRef:
    apiVersion: apps/v1
    kind: Deployment
    name: webapp
  minReplicas: 1
  maxReplicas: 4
  metrics:
  - type: Pods
    pods:
      metric:
        name: request-per-second
          selector:
            matchLabels:
              verb: GET
      target:
        type: AverageValue
        averageValue: 100
Summary
In this article, we went through the concept of HorizontalPodAutoscaler and how you can define it with either out-of-box metrics from Kubernetes API or based on custom metrics that your monitoring system supports and collects.
There is a lot more to the HPA topic since there are a number of possibilities, but at least you got an introduction, and you can, of course, continue digging into this based on your specific needs.
I hope you enjoyed reading the article.
Can I copy to my notes?